Objective:
To assess the metabolic, body composition, and physiological effects of tirzepatide therapy, we will employ continuous wearable monitoring, serial DEXA imaging, and comprehensive blood panels. Our objective is to determine if continuous monitoring can detect clinically significant changes that standard care might overlook.
Data: 134 days of continuous Ultrahuman Ring AIR and M1 CGM data (92 days pre-drug baseline, 42 days on-drug), two DEXA scans (GE Lunar Prodigy Advance), and two 69-marker blood panels (Ultrahuman Blood Vision and Unilabs) from a single male subject, age 44, with insulin resistance.
Findings:
Conclusion:
Continuous wearable monitoring identified clinically relevant findings, including activity collapse and lean mass composition near sarcopenia thresholds, that would not have been detected under standard prescribing protocols. Comprehensive blood panel analysis revealed a mixed cardiovascular response: substantial atherogenic particle clearance (ApoB -28.3%) alongside declining cardioprotective markers (ApoA1 -23.2%, HDL -18.5%), a nuance invisible to standard lipid panels.
GLP-1 receptor agonists have demonstrated clinically significant effects on body weight and metabolic markers in large randomized controlled trials. Tirzepatide, a dual GLP-1/GIP receptor agonist [1], produces 15-22% body weight reductions and reverses insulin resistance [2,3]. The clinical evidence for efficacy is robust.
The standard monitoring model for GLP-1 therapy, however, remains limited: prescription, periodic weight measurement, and quarterly follow-up. This protocol captures one variable (scale weight) at low temporal resolution. Weight loss is not a unitary outcome. It comprises a ratio of fat mass, lean mass, and bone mineral. This ratio determines whether a patient arrives at a lower weight with preserved function or with early sarcopenia and declining bone density [5-7]. Activity patterns, sleep architecture, glucose dynamics, and cardiovascular risk markers all shift during GLP-1 therapy but remain invisible under interval-based care.
The gap between what GLP-1 agonists change and what standard monitoring captures is substantial. Wearable devices have enabled continuous, real-time measurement of physiological parameters at scale, providing an objective means to detect biological changes that would otherwise go unrecorded between clinical visits. Serial body composition imaging (DEXA) quantifies what the scale cannot: the structural composition of weight loss.
This paper documents a single-subject case study combining continuous Ultrahuman Ring AIR monitoring, serial DEXA, and comprehensive blood panels (Ultrahuman Blood Vision) to characterize the full physiological response to tirzepatide therapy. Most importantly, it evaluates the incremental diagnostic value of continuous monitoring over standard care.
Male, age 44. BMI 25.5, body fat 34.6% (DEXA), HOMA-IR 3.48 (insulin resistant) [9]. No prior diagnosis of diabetes or cardiovascular disease. Standard screening markers (HbA1c 5.4%, fasting glucose 90 mg/dL) were within normal limits; insulin resistance was identified only through HOMA-IR calculation, lipid particle analysis, and body composition data.
Self-reported dietary intake during the on-drug period: ~1,300-1,400 kcal/day (below RMR of 1,688-1,768 kcal/day), ~120 g protein (~1.5 g/kg), ~30 g fiber. Two resistance training sessions were performed across the 42-day on-drug period (effectively zero structured RT). Physical activity was otherwise limited to spontaneous movement.
Tirzepatide (Mounjaro) initiated January 27, 2026 at 2.5 mg weekly, escalated to 5 mg after week 4 (day 28) in accordance with standard titration protocol. Total on-drug duration: 6 weeks (January 27 to March 9, 2026). Gastric side effects were mild: transient stomach noise in the first few days and some constipation, which resolved with increased fiber intake (chia seeds and psyllium husk). No nausea, vomiting, or other GI adverse events were reported.
Ultrahuman Ring AIR: Continuous physiological monitoring including sleep HRV, resting heart rate, deep sleep duration, sleep efficiency, daily steps, activity score, and recovery score. 134 days total: 92 days pre-drug baseline, 42 days on-drug. The subject serves as their own control. The Activity Score is a proprietary composite metric scored 20-100 that integrates active hours, sedentary time, step density, and workout frequency into a single daily activity measure. The Recovery Score is a proprietary composite metric scored 5-100 that integrates sleep quality, heart rate variability, resting heart rate, and skin temperature deviation, with dynamic weighting that amplifies the worst-performing contributor.
Blood panels (69 markers): Full metabolic panel, lipid particle analysis (NMR), inflammatory markers, hormonal panel, CBC, liver and kidney function. Baseline: January 3, 2026 (Ultrahuman Blood Vision). Follow-up: February 18-20, 2026 (Unilabs haematology).
DEXA (GE Lunar Prodigy Advance): Full body composition including regional fat distribution, lean mass, bone mineral density, Visceral Adipose Tissue (VAT) estimation. Baseline: January 16, 2026. Follow-up: March 9, 2026.
These data streams are integrated through the Ultrahuman GLP-1 PowerPlug, a monitoring stack purpose-built for GLP-1 therapy. The PowerPlug computes 7-day pre- and post-dose physiological baselines per titration cycle (HRV, RHR, sleep, temperature, SpO2) from Ring AIR data, runs a rule-based inference engine that produces structured daily insights across 17 insight categories, and operates a Safety Radar that aggregates Ring metrics, symptom logs (14-day window), dose history (60-day window), and blood biomarkers (180-day window) into a tiered risk assessment (Critical/Warning/Caution/Attention/Good) with actionable intervention cards.
Pre-drug and on-drug Ring AIR metrics were compared as period means (92 days vs 42 days). Blood markers were compared as absolute and percentage changes between two time points. DEXA body composition changes were calculated as absolute mass changes and percentage contributions to total weight loss. Weight loss composition was benchmarked against DEXA-verified clinical trial data from SURMOUNT-1 (n=160),[2] SEMALEAN (n=115),[4] a meta-analysis of 22 RCTs (n=2,258),[5] and a resistance training case series[7].
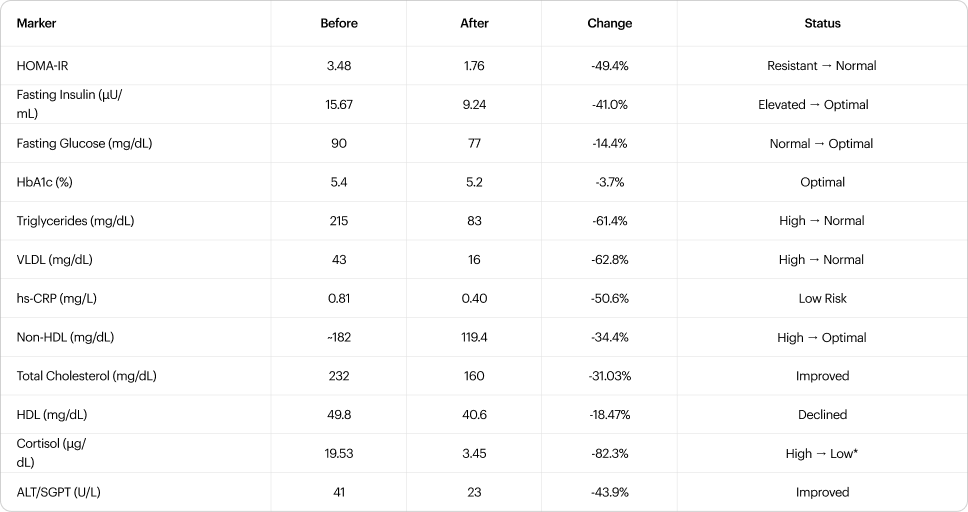
Metabolic correction occurred rapidly. In just seven weeks on tirzepatide, HOMA-IR dropped from 3.48 to 1.76, fasting insulin fell 41%, and triglycerides collapsed 61%. By targeting both GLP-1 and GIP receptors, tirzepatide improves beta-cell function and peripheral insulin sensitivity simultaneously [1].
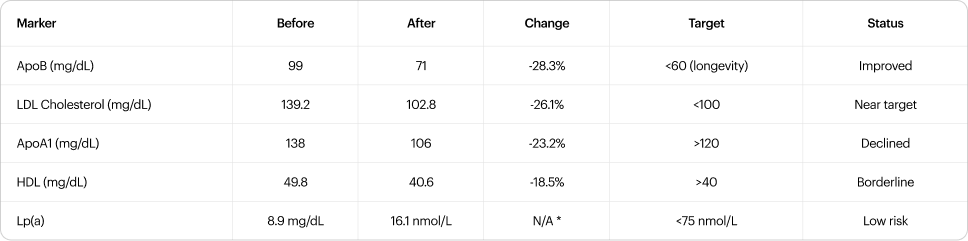
ApoB declined from 99 to 71 mg/dL (-28.3%), paralleling the LDL reduction (139.2 to 102.8, -26.1%) and consistent with genuine atherogenic particle clearance rather than mere VLDL-to-LDL remodeling [11]. This contrasts with the modest ApoB reduction relative to triglyceride effect reported in SURPASS trials, where particle remodeling rather than clearance was the dominant mechanism [12]; the larger ApoB response observed here may reflect the subject's baseline hypertriglyceridemia (215 mg/dL) providing a greater substrate for particle clearance. Pre-treatment LDL-P was 2,128 nmol/L (Blood Vision, January). However, two adverse signals emerged. HDL declined to 40.6 mg/dL (from 49.8, -18.5%), now borderline at the 40 mg/dL clinical threshold. ApoA1 fell from 138 to 106 mg/dL (-23.2%), dropping below the >120 mg/dL target and indicating reduced HDL particle number, not just cholesterol content [11]. The combination of improved atherogenic clearance with declining cardioprotective particles represents a mixed cardiovascular profile. Mendelian randomization data demonstrate that genetically lower ApoB is causally associated with longer lifespan and reduced cardiovascular events [13]; the longevity target of ApoB <60 mg/dL requires a further 15% reduction from current levels (71 to <60), which may be achievable with continued therapy or modest pharmacological lipid-lowering. The HDL/ApoA1 decline warrants monitoring, as it may reflect caloric restriction and rapid weight loss rather than a direct drug effect.

All hepatic enzymes declined: AST -36%, GGT -28%, Alk Phos -5.4%. Albumin remained stable (4.7 to 4.6 g/dL), indicating preserved hepatic synthetic function. Total bilirubin increased from 0.6 to 0.87 mg/dL (+45%); both values fall within normal range (upper limit 1.2 mg/dL), and the rise is consistent with caloric restriction suppressing hepatic UGT1A1 conjugation activity and elevating non-esterified fatty acids that compete for bilirubin uptake [14], rather than hepatocellular injury, given the concurrent improvement in transaminases. Renal markers were stable: creatinine 0.81 to 0.76 mg/dL, BUN 19.0 to 15.0 mg/dL (-21.1%), uric acid 6.2 to 6.0 mg/dL. The BUN decline is consistent with reduced dietary protein catabolism secondary to sub-RMR caloric intake [15], as creatinine (a catabolism-independent filtration marker) remained normal.
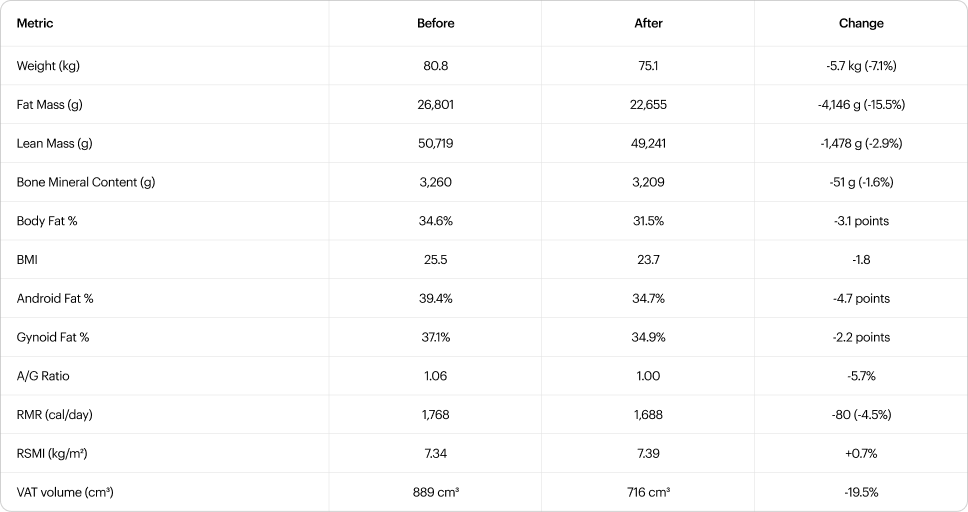
Of the 5.7 kg lost, 73.1% was fat mass (4,146 g), 26.0% lean mass (1,478 g), and 0.9% bone mineral (51 g). This ratio was compared against DEXA-verified clinical trial data (Table 2b).
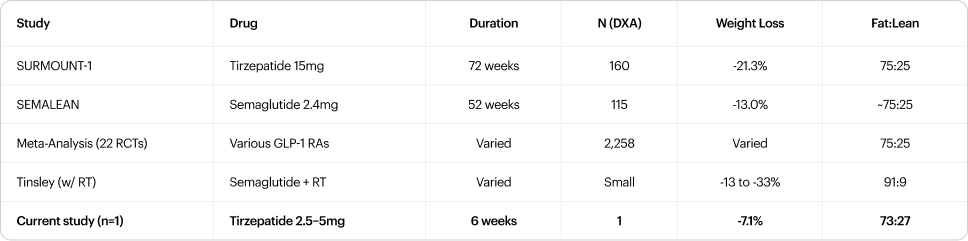
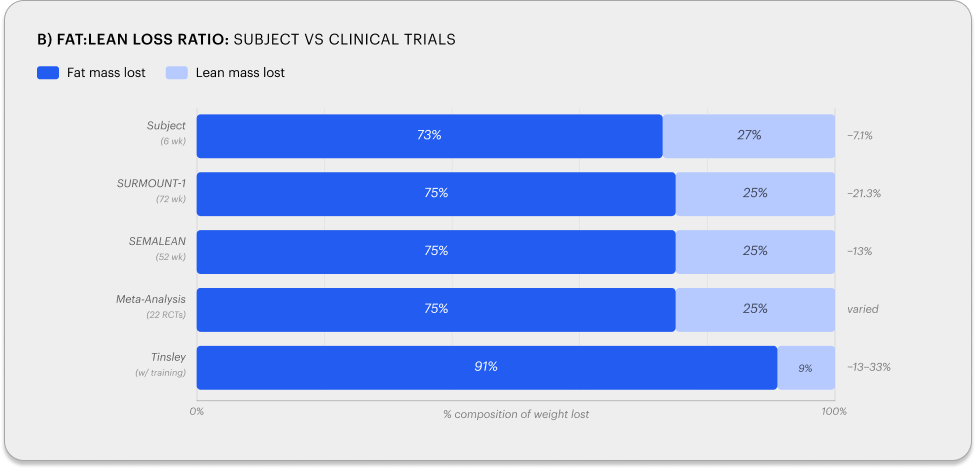
The 73:27 ratio is consistent with the ~75:25 reported across the meta-analysis of 22 RCTs (n=2,258 with DXA) [5]. RSMI was 7.34 kg/m² pre-tirzepatide and 7.39 kg/m² post-treatment (+0.7%), both above the EWGSOP2 sarcopenia threshold of 7.0 kg/m² [6]. Notably, appendicular lean mass was preserved (arms + legs: 23,270 -> 23,416g, +0.6%) while the entire 1,478g lean mass loss came from the trunk. Handgrip strength was unchanged (47.5 kg pre, 47.4 kg post, -0.2%), confirming preserved muscle function consistent with the EWGSOP2 assessment framework [6]. This regional pattern suggests that at six weeks, skeletal muscle relevant to functional capacity and sarcopenia classification was not compromised, though the margin above threshold (0.34-0.39 kg/m²) remains narrow enough to warrant monitoring if therapy continues without resistance training. Protein intake (~1.5 g/kg) exceeded the 1.2 g/kg minimum recommended for lean mass preservation during weight loss. The absence of resistance training (two sessions across 42 days) is the most likely explanation for the 26% lean mass fraction. GLP-1-mediated weight loss without structured resistance training consistently produces ~25% lean mass loss across trials [2-5], while the addition of resistance training 3-5 days per week has shifted this ratio to as low as 91:9 in a DEXA-verified case series [7].
At -7.1% in six weeks (~1.2%/week), the rate of loss is approximately 4x faster than the SURMOUNT-1 steady-state trajectory (~0.3%/week over 72 weeks). Self-reported caloric intake below RMR created an estimated daily deficit of 600-800 kcal before accounting for activity expenditure. Over 42 days, the cumulative deficit (~25,000-34,000 kcal) predicts 3.2-4.4 kg from energy balance alone; the remaining ~1.3-2.5 kg likely reflects early water and glycogen depletion.
Android fat decreased by 4.7 points (39.4% to 34.7%), trunk by 4.2 points, gynoid by 2.2 points, and limbs by 2.0-2.3 points (uniform). The A/G ratio improved from 1.06 to 1.00 (target: <0.95). CoreScan-measured visceral adipose tissue declined from 889 to 716 cm³ (-19.5%), with subcutaneous adipose tissue declining proportionally (1,719 to 1,376 cm³, -20.0%). Android fat reduction represents the most clinically significant regional change, as it directly reflects the visceral depot driving the insulin-resistant phenotype.
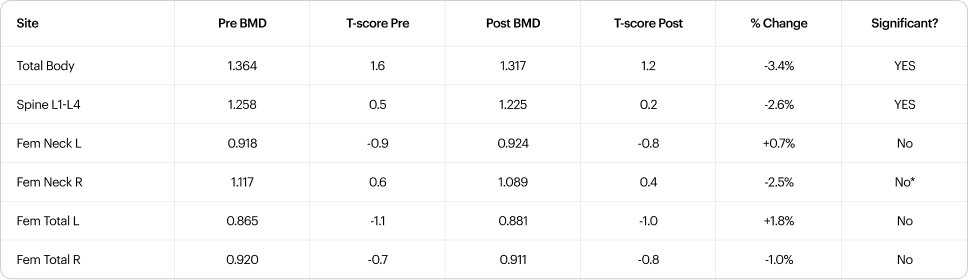
The ISCD considers a change exceeding the Least Significant Change (LSC, typically 2-3% for total body and 3-5% for spine on GE Lunar systems) as real rather than measurement noise [16]. Total body (-3.4%) and lumbar spine (-2.6%) both meet this criterion. The left femoral neck T-score of -0.9 and left total hip T-score of -1.1 place these in the osteopenic range and warrant monitoring [18].
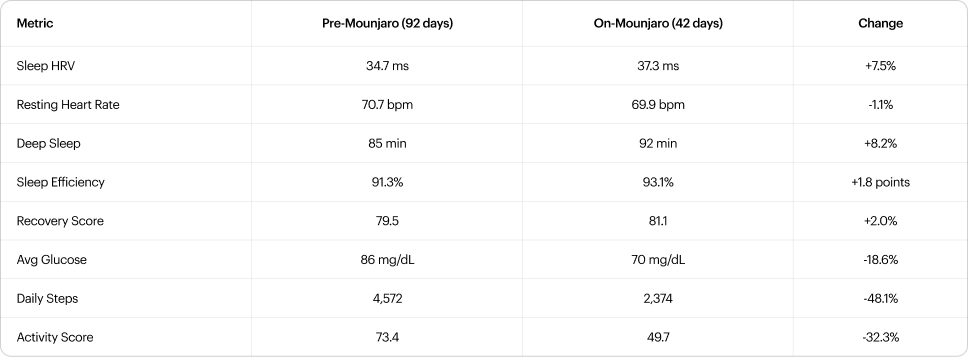
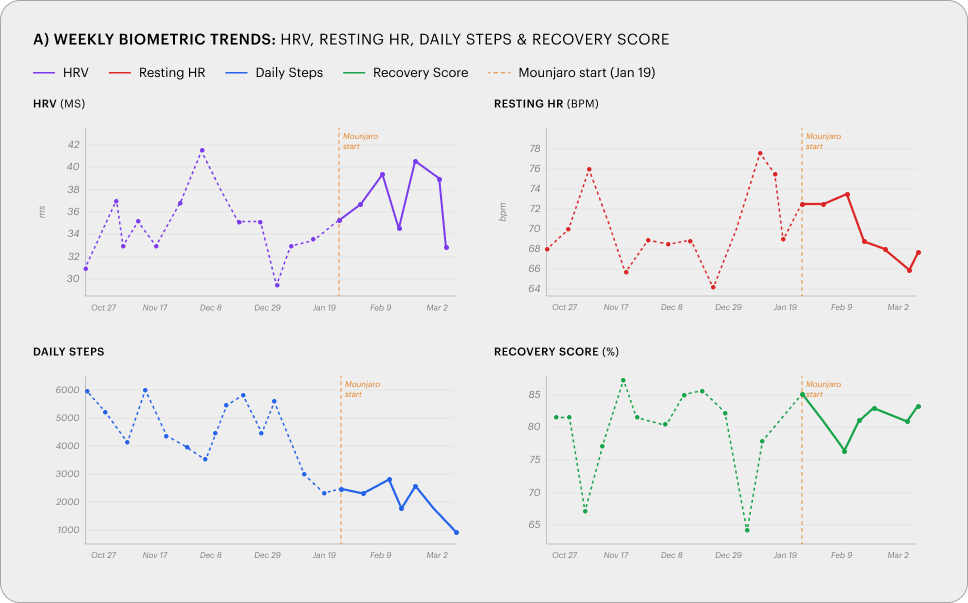
Sleep and autonomic metrics improved across the on-drug period: HRV +7.5%, deep sleep +8.2%, sleep efficiency +1.8 points, average glucose -18.6% (86 to 70 mg/dL). All improvements were detectable from week 1.
Simultaneously, daily steps declined 48% (4,572 to 2,374) and activity score declined 32% (73.4 to 49.7). This pattern is partly attributable to reduced travel during the on-drug period relative to a travel-heavy baseline, and partly consistent with reduced caloric intake suppressing spontaneous physical activity, a phenomenon well-documented during energy restriction [8], likely amplified by GLP-1-mediated appetite suppression. The relative contribution of each factor cannot be determined from this data. The activity decline was visible from week 1 of continuous monitoring and would not have been detected at a standard interval-based follow-up. The downstream consequences include accelerated lean mass loss, reduced bone loading, and declining fitness capacity.
The standard monitoring protocol for GLP-1 therapy consists of periodic weight measurement and quarterly follow-up. This study identified four clinically relevant findings that would not have been detected under that model. Each was captured by a specific component of the Ultrahuman GLP-1 PowerPlug.
Ring AIR detected the 48% decline in daily steps and 32% drop in activity score from week 1 of therapy. Continuous step and activity tracking converts an invisible behavioral change into a quantifiable, time-stamped signal that can trigger intervention within days rather than months. Ring AIR also captured simultaneous improvements in sleep architecture (HRV +7.5%, deep sleep +8.2%, sleep efficiency +1.8 points), providing objective evidence that the drug produces beneficial autonomic changes alongside the adverse activity suppression.Standard care relies on patient self-report at quarterly visits and would not have identified this activity collapse until its downstream consequences like accelerated lean mass loss, reduced bone loading, and declining fitness had already compounded.
M1 CGM documented the 18.6% decline in average glucose (86 to 70 mg/dL), confirming tirzepatide's mechanism of action in real time. For patients on GLP-1 therapy with pre-existing insulin resistance, continuous glucose data detects hypoglycemic episodes or excessive glucose suppression before they become symptomatic.
Blood Vision established the pre-treatment particle-level baseline (ApoB 99 mg/dL, LDL-P 2,128 nmol/L, ApoA1 138 mg/dL) that made the post-treatment comparison interpretable. Follow-up panels showed ApoB declined to 71 mg/dL (-28.3%) and LDL to 102.8 mg/dL (-26.1%), confirming genuine atherogenic particle clearance rather than mere lipid redistribution. A standard lipid panel would have shown triglyceride and cholesterol improvement but would not have captured the ApoA1 decline (138 to 106, -23.2%) or the HDL drop to borderline (40.6 mg/dL), both of which indicate reduced cardioprotective capacity. Blood Vision also detected cortisol suppression (-82.3%), which is not captured under standard GLP-1 prescribing protocols.
Safety Radar is an automated clinical safety analysis system within the GLP-1 PowerPlug that ingests data from six sources - Ring metrics (HRV, RHR, temperature deviation, recovery; 7-day window), symptom logs (14-day window), dose history (60-day window), blood biomarkers (180-day window), weight and muscle mass entries (14-day window), and food logs (7-day window) - and produces a tiered risk assessment across five severity levels (Critical, Warning, Caution, Attention, Good). Each assessment generates up to three prioritized alerts drawn from 17 detection scenarios spanning six categories: ring metrics, blood markers, symptoms, nutrition, body composition, and medication journey. Alerts are accompanied by actionable intervention cards with specific next steps. Safety Radar re-evaluates automatically whenever new data arrives (weight logged, dose taken, symptom reported, blood results received, or daily sleep data processed), rather than waiting for a scheduled clinical visit.
The gap demonstrated in this study is not a lack of effective therapy. Tirzepatide produced metabolic correction consistent with published benchmarks. The gap is in monitoring: without continuous, integrated data collection, the adverse trade-offs of GLP-1 therapy remain invisible until they become clinical problems. The GLP-1 PowerPlug closes this gap by combining continuous physiological monitoring (Ring AIR, M1 CGM) with deep phenotyping (Blood Vision, DEXA) and automated risk detection (Safety Radar) into a single monitoring stack built for the GLP-1 use case.
This is a single-subject (n=1), non-randomized, unblinded before/after comparison.