
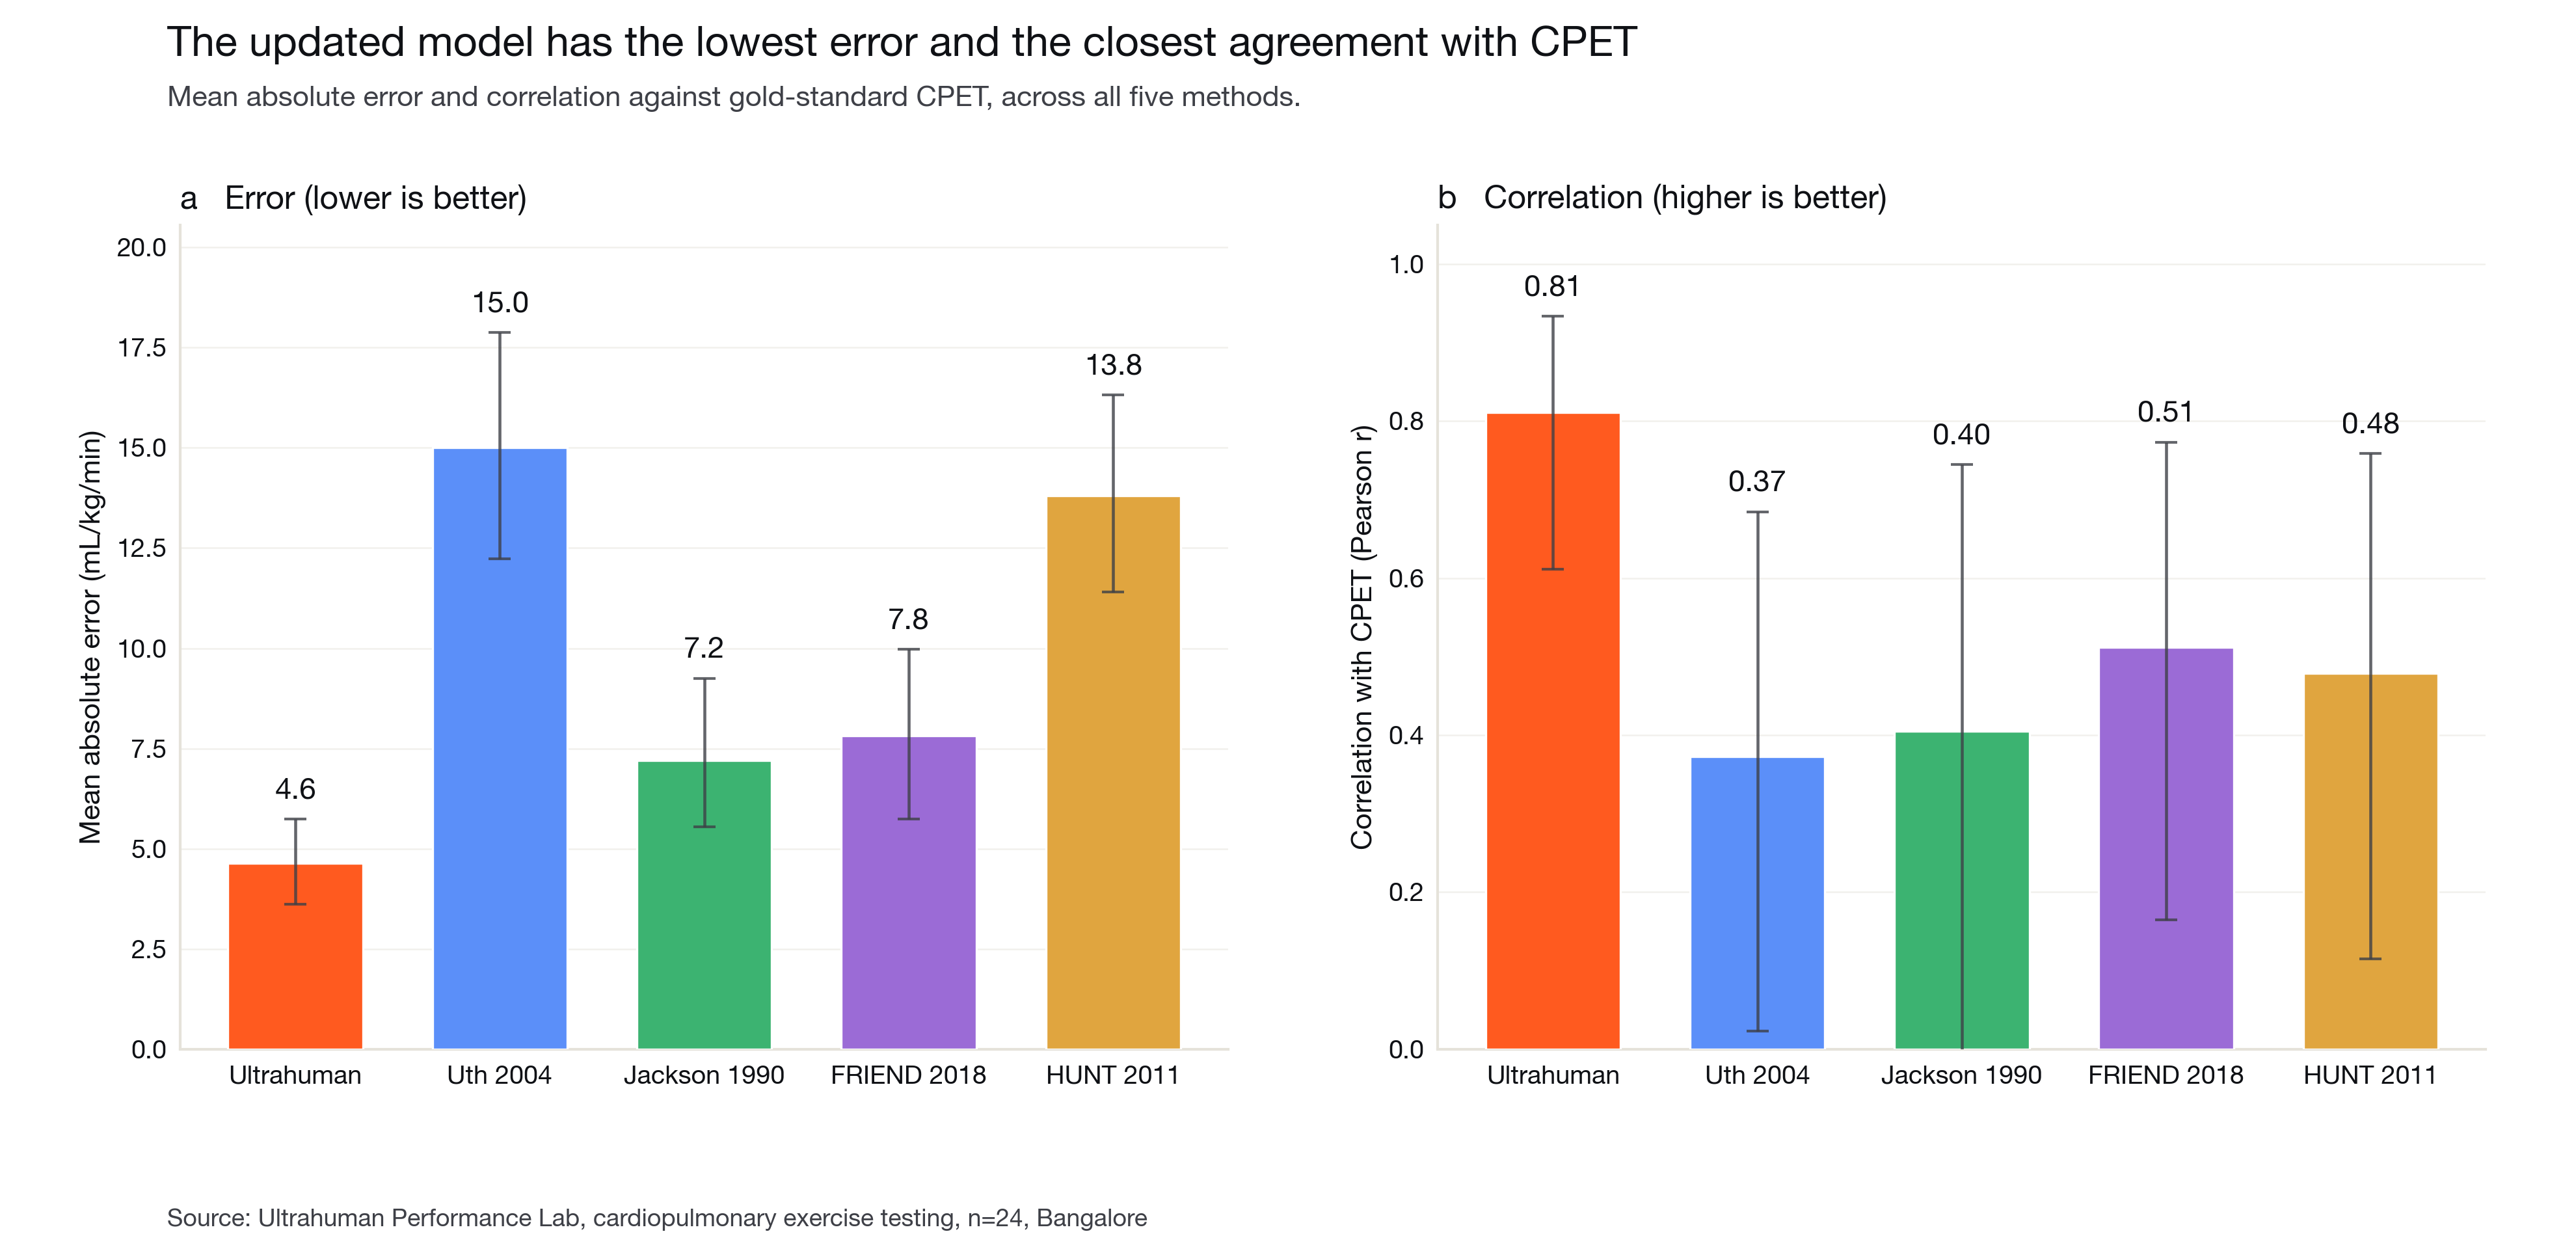
• The updated model agrees closely with measured CPET: a mean absolute error of just 4.6 mL/kg/min and the highest correlation of any method tested (r = 0.81), across a fitness range of 22.4 to 49.3 mL/kg/min in 24 lab-tested members.
• It outperforms four established published formulas on the same ground truth. Uth (2004), Jackson (1990), FRIEND (2018), and HUNT (2011) each overestimated VO2 max, with errors of 7.2 to 15.0 mL/kg/min and weaker correlations (r 0.37 to 0.51). The updated model has the lowest error and the smallest bias of all five.
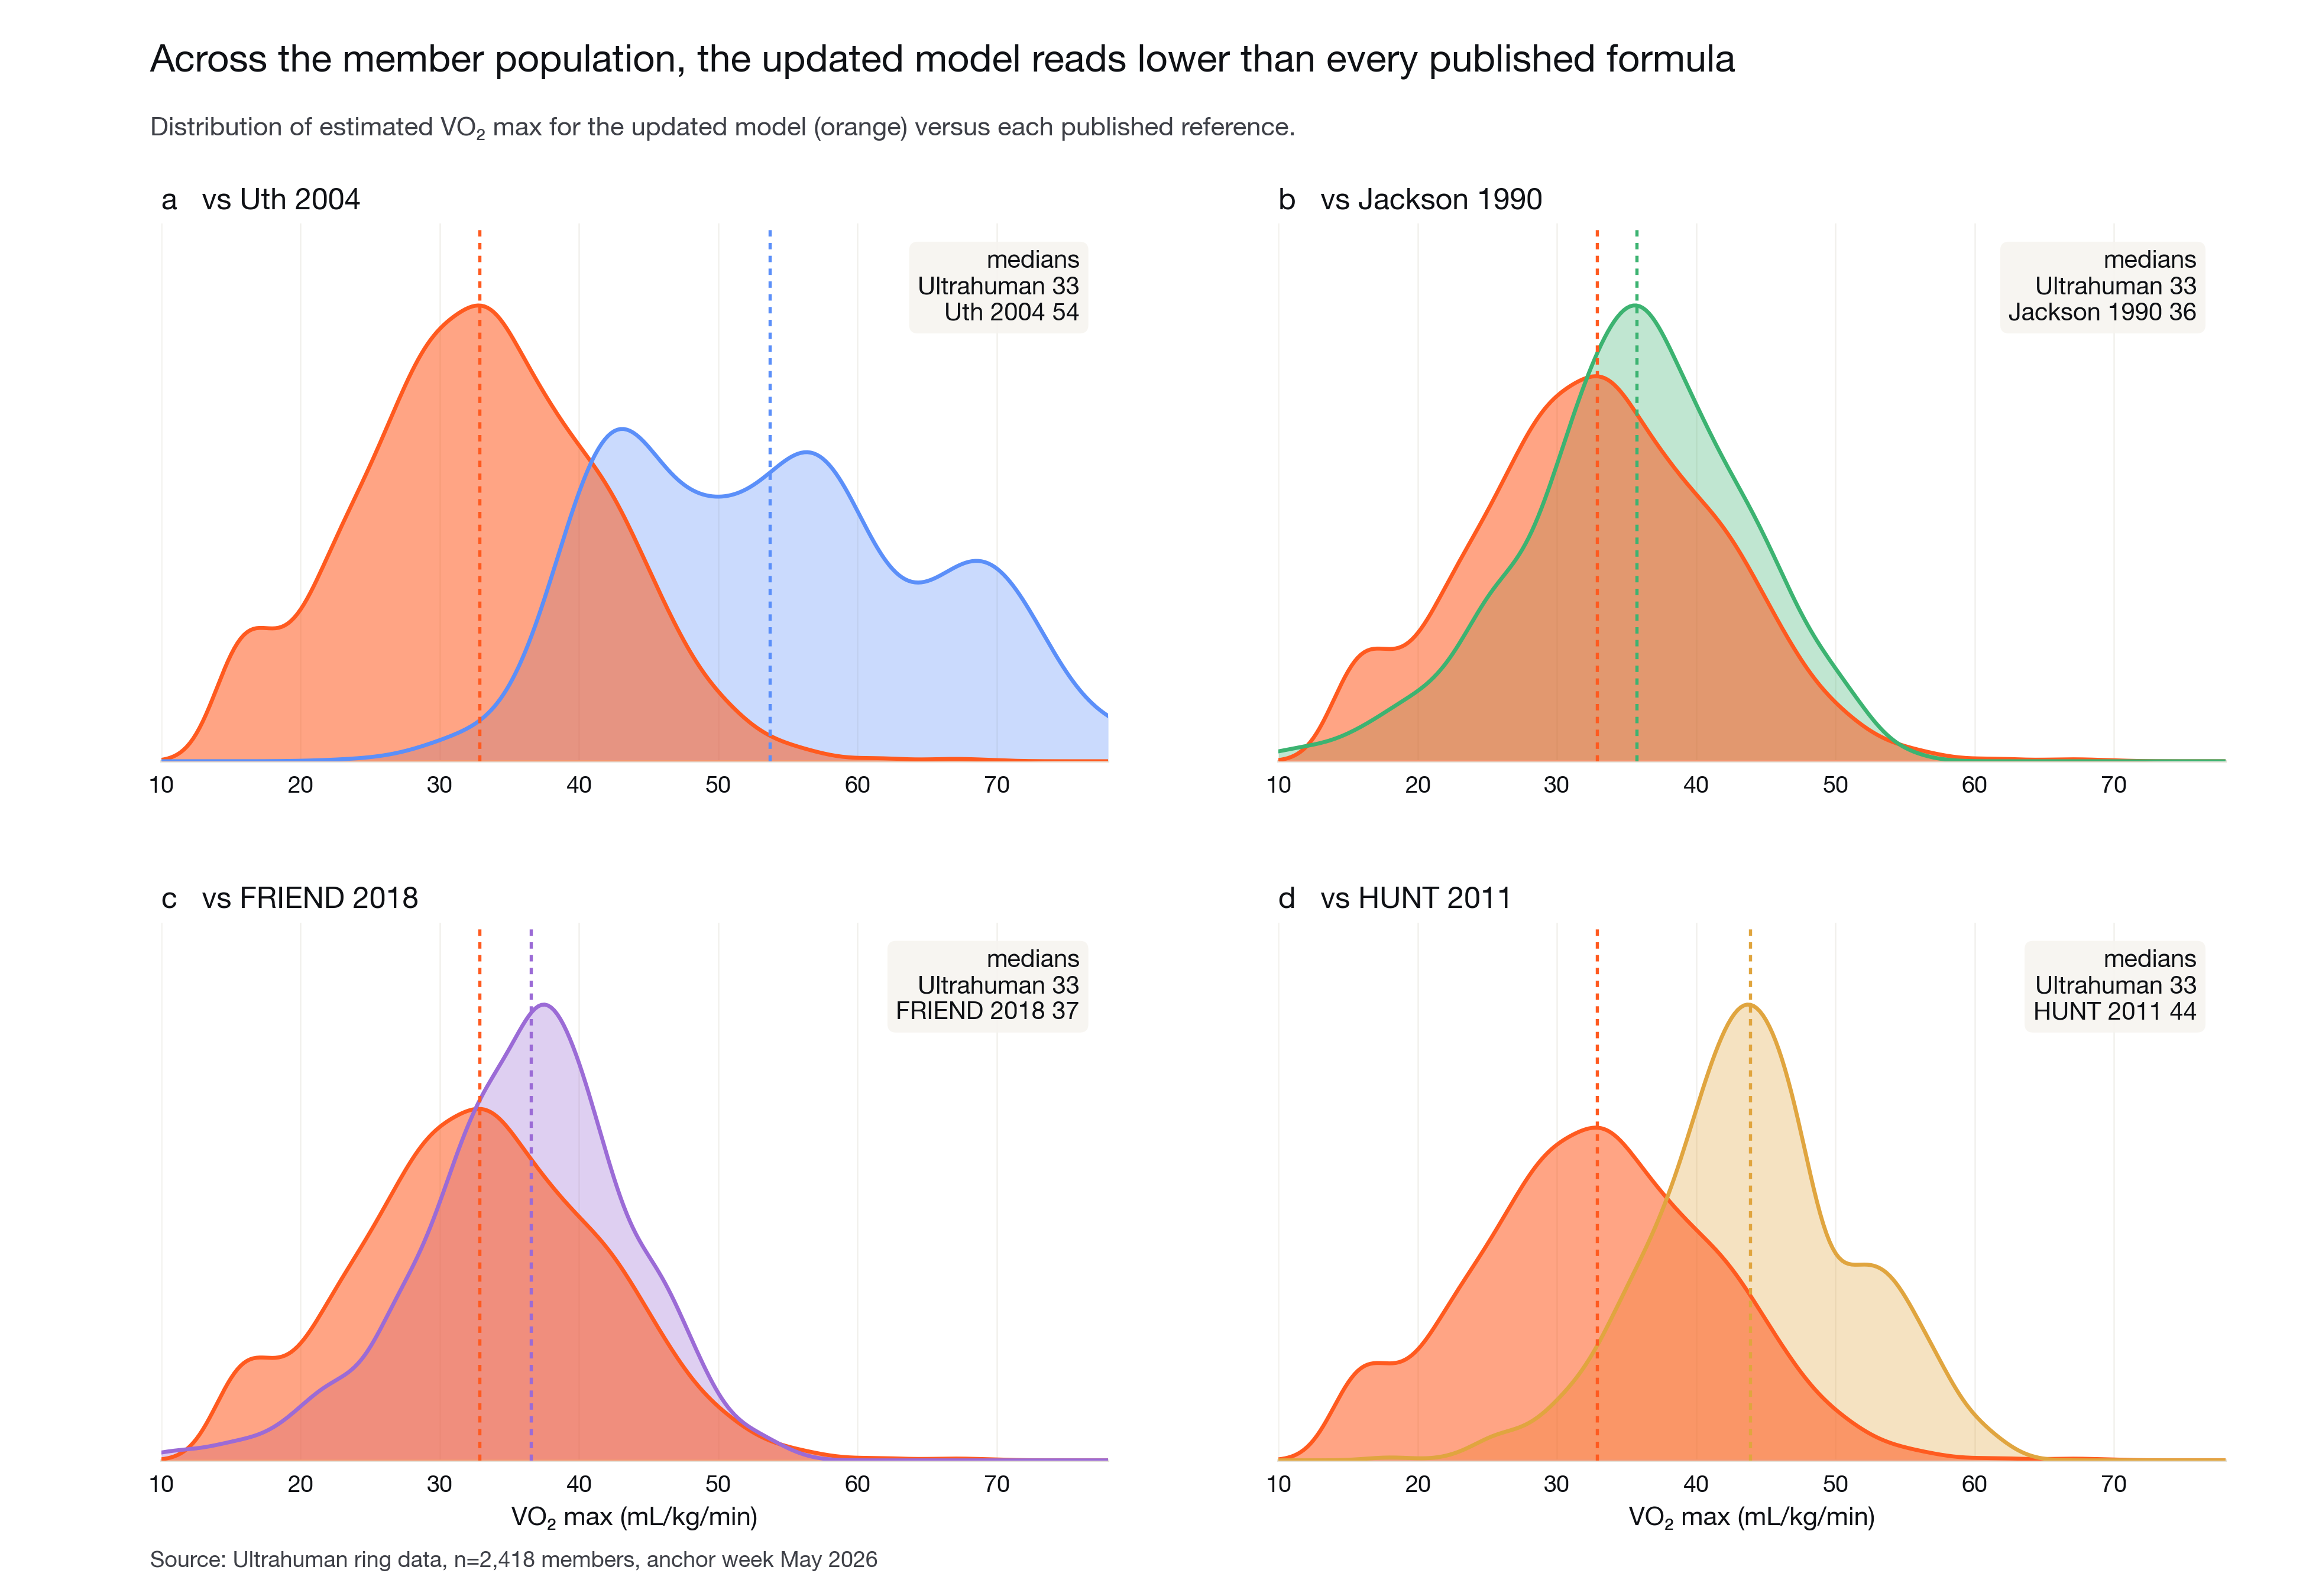
• Every published formula reads high; the updated model does not. Across 2,418 members, the updated model’s median estimate is 33 mL/kg/min, below every published formula (medians 36 to 54), tracking the physiology rather than inflating it.
• Ultrahuman measures one of the most consequential longevity biomarkers in-house, by CPET in its Bangalore Performance Lab, and tunes the ring estimate to that ground truth.
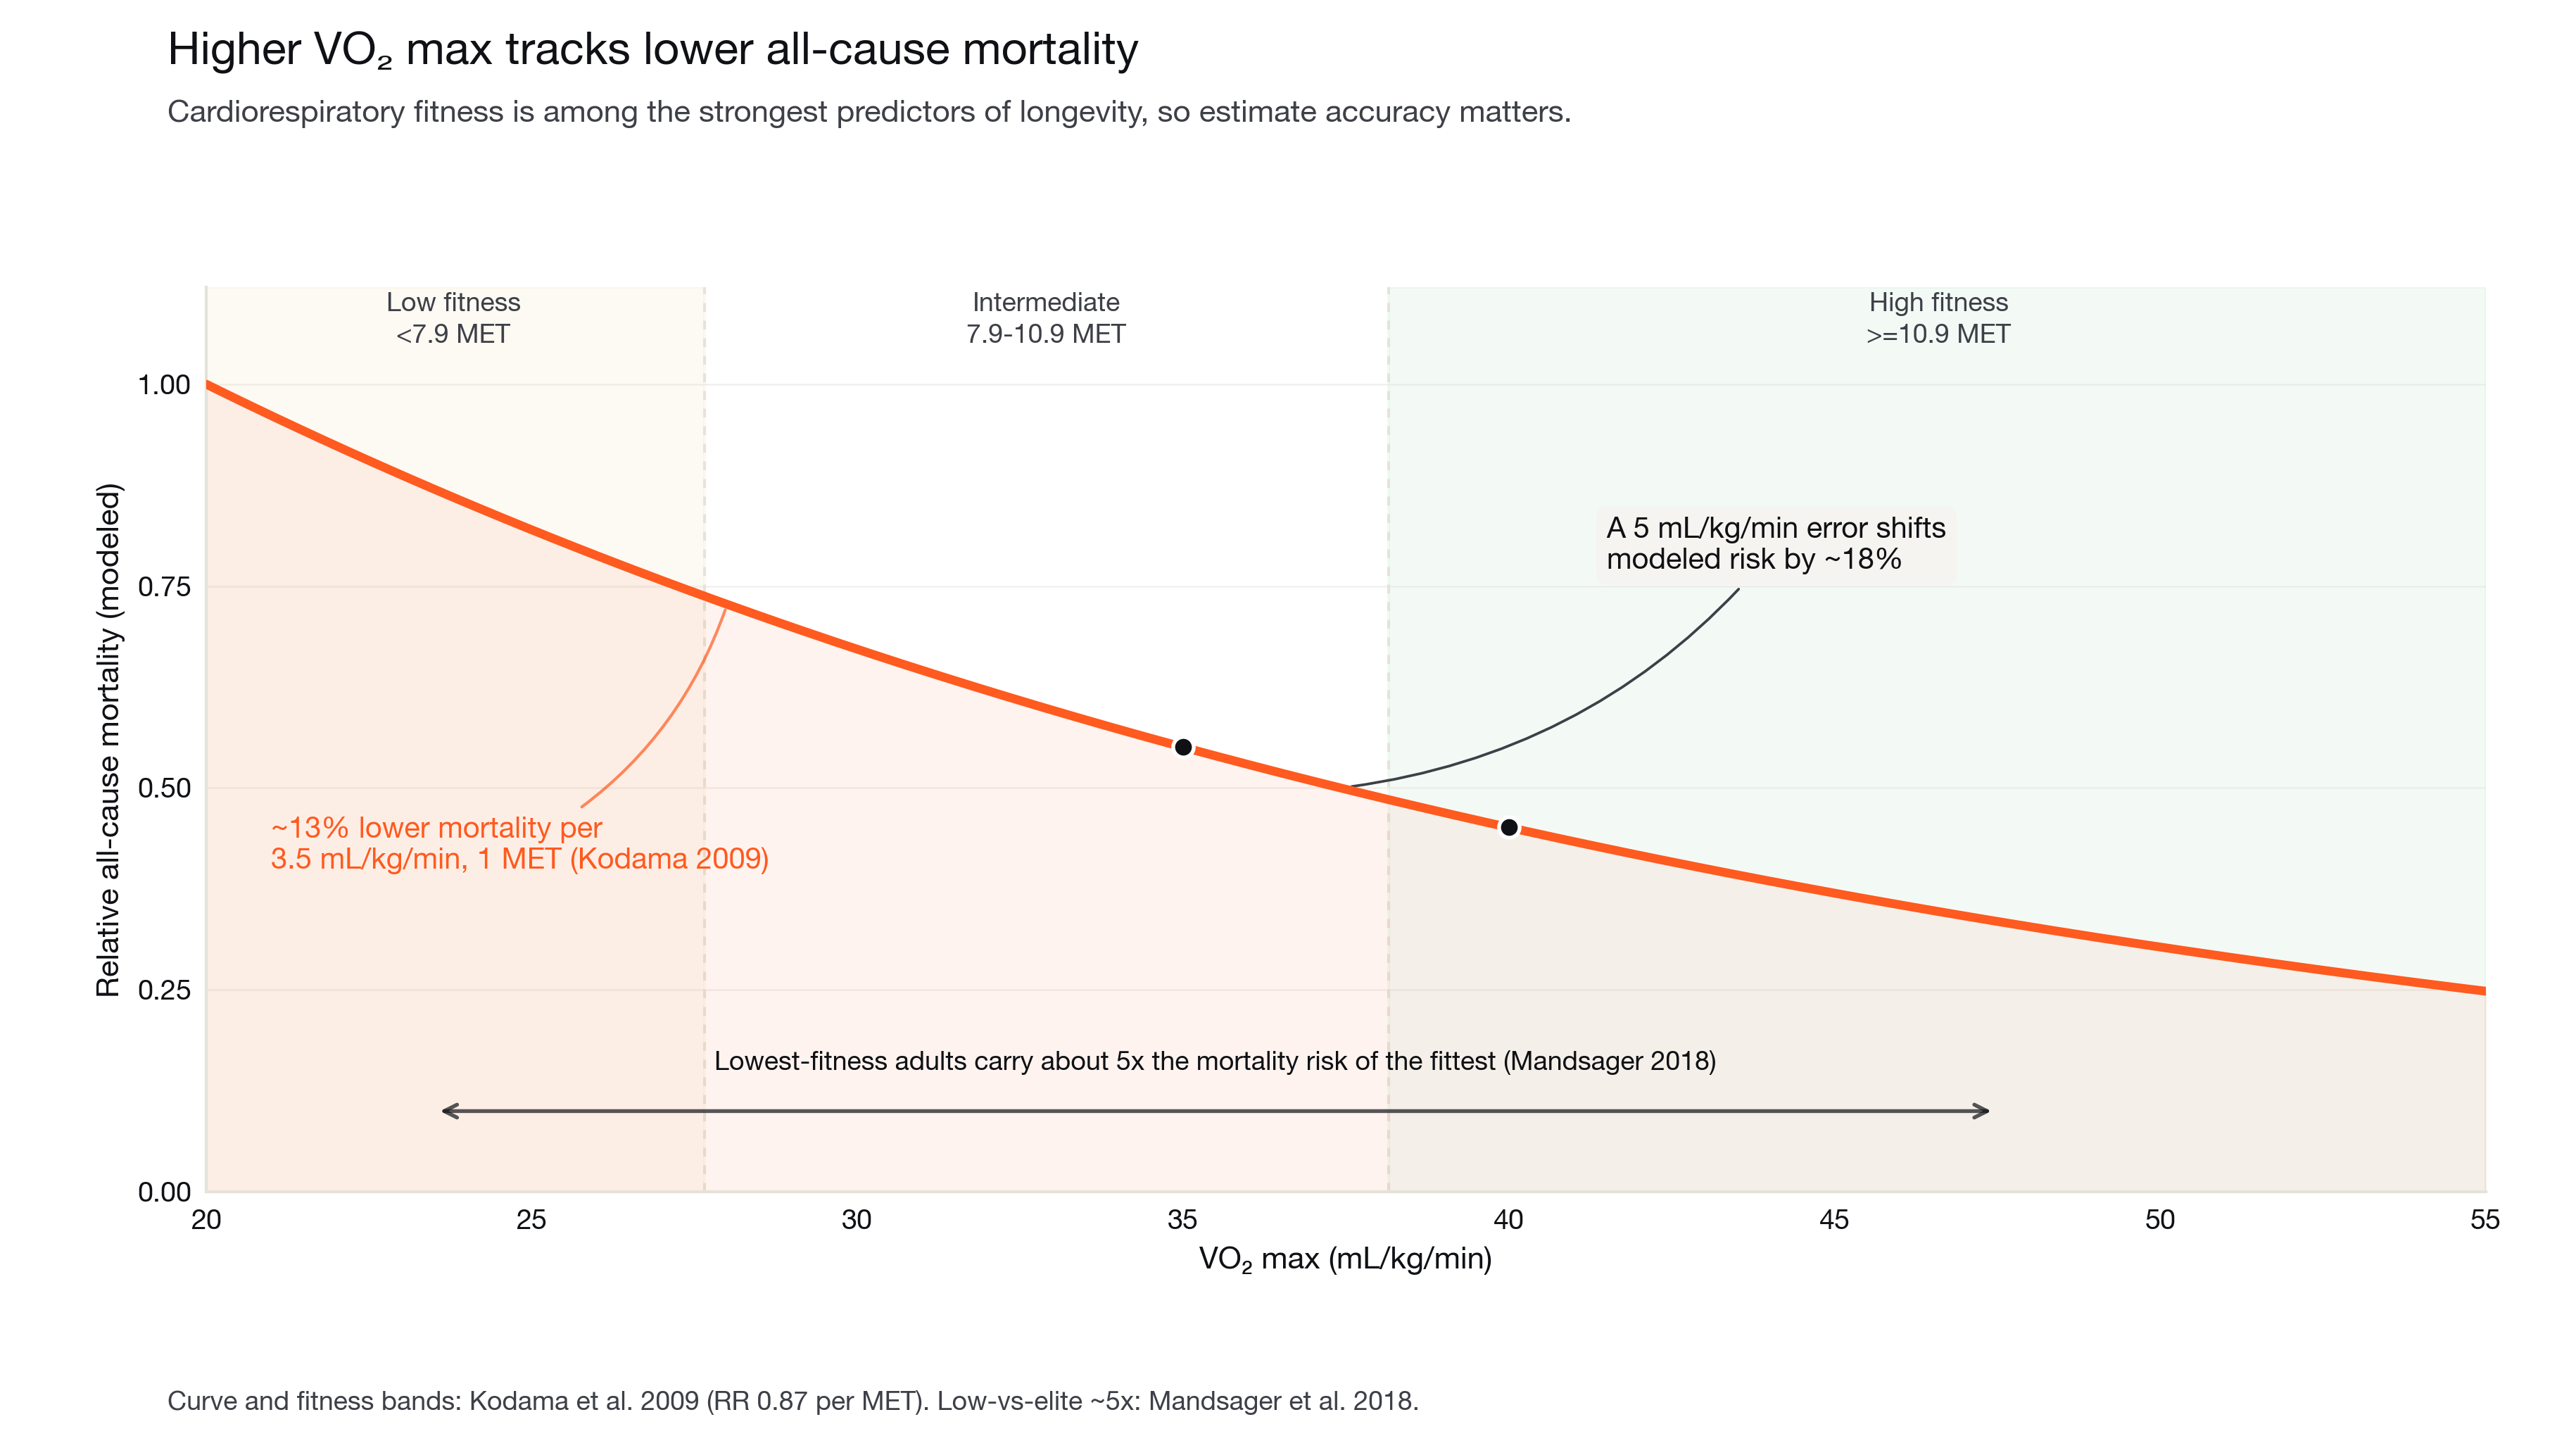
VO2 max, the maximal rate of oxygen uptake during exercise, is the benchmark of cardiorespiratory fitness and among the strongest predictors of all-cause mortality [1, 2]. The association is steep and continuous: each 3.5 mL/kg/min (one metabolic equivalent, or MET) of higher fitness is associated with roughly 13% lower all-cause mortality [1], and adults in the lowest fitness band carry about five times the mortality risk of the fittest [2]. Cardiorespiratory fitness has been proposed as a clinical vital sign for exactly this reason [3] (Figure 1).
The reference method for VO2 max is cardiopulmonary exercise testing (CPET): a graded exercise test to exhaustion with breath-by-breath analysis of inspired and expired gases [4]. It is accurate and it is rare. Most people never take one, so wearables estimate VO2 max instead, from heart rate and activity. Many estimators have been published over the past three decades, each derived on a particular population and set of inputs, and they do not always agree.
Because the number carries real meaning for longevity, its accuracy matters. A reading that is systematically high can place someone in a more reassuring fitness band than their physiology supports. Ultrahuman’s approach is to measure the ground truth directly and tune the estimate to it.
The Performance Lab and the reference test. Members were tested in the Ultrahuman Performance Lab in Bangalore using a standard graded CPET: a progressive treadmill protocol carried to volitional exhaustion while a metabolic cart recorded oxygen uptake breath by breath. Peak oxygen uptake was taken as the reference VO2 max. Each tested member wore an Ultrahuman Ring over the same period, so the lab value and the ring inputs describe the same person at the same time.
Cohort. The validation set is 24 members spanning a wide fitness range, with measured VO2 max from 22.4 to 49.3 mL/kg/min (median 35.0). The rangecovers low through high fitness, so the comparison is not limited to one end of the spectrum.
The updated model. The updated estimate combines several established physiological methods, a heart-rate-ratio term, aheart-rate-reserve term, and age, sex, and non-exercise terms, into a single ensemble, then calibrates the blend against the lab ground truth. Its inputs are all ring-derived: sleeping resting heart rate, an age- and activity-based estimate of maximal heart rate, age, sex, body metrics, and an activity tier from daily step counts. The model also applies a population-level calibration so estimates are centred correctly across the global member base; on this single-population lab cohort that calibration leaves a small positive offset (mean bias +3.5 mL/kg/min), smaller than that of any published formula tested.
Published baselines. Four established estimators were computed from the same ring inputs and scored against the same CPET values: the Uth heart-rate-ratio method [5], the Jackson non-exercise regression [6], the FRIEND registry reference equation [7], and the HUNT non-exercise model [8]. Input mappings are documented; HUNT additionally requires waist circumference and a structured activity questionnaire, which a ring does not capture, sothose were approximated from body-mass index and activity tier (HUNT is therefore the most approximated baseline).
Population analysis. To see how each method behaves at scale, all five estimates were computed for 2,418 members from one week of ring data, one value per member.
Statistics. Agreement with CPET was summarised by mean absolute error, root-mean-square error, mean bias, Pearson correlation, and Bland-Altman limits of agreement. Ninety-five percent confidence intervals were obtained by bootstrap resampling.
The updated model tracks measured VO2 max; the published formulas read high. Against CPET, the updated model reached a correlation of r = 0.81 and a mean absolute error of 4.6 mL/kg/min, with its points tracking the line of agreement most closely. The four published formulas sat above that line and scattered more widely: correlations of 0.37 (Uth), 0.40 (Jackson), 0.51 (FRIEND), and 0.48 (HUNT), with mean absolute errors of 15.0, 7.2, 7.8, and 13.8 mL/kg/min respectively (Figure 2 and 3). The updated model has the lowest error and the highest agreement of the five.
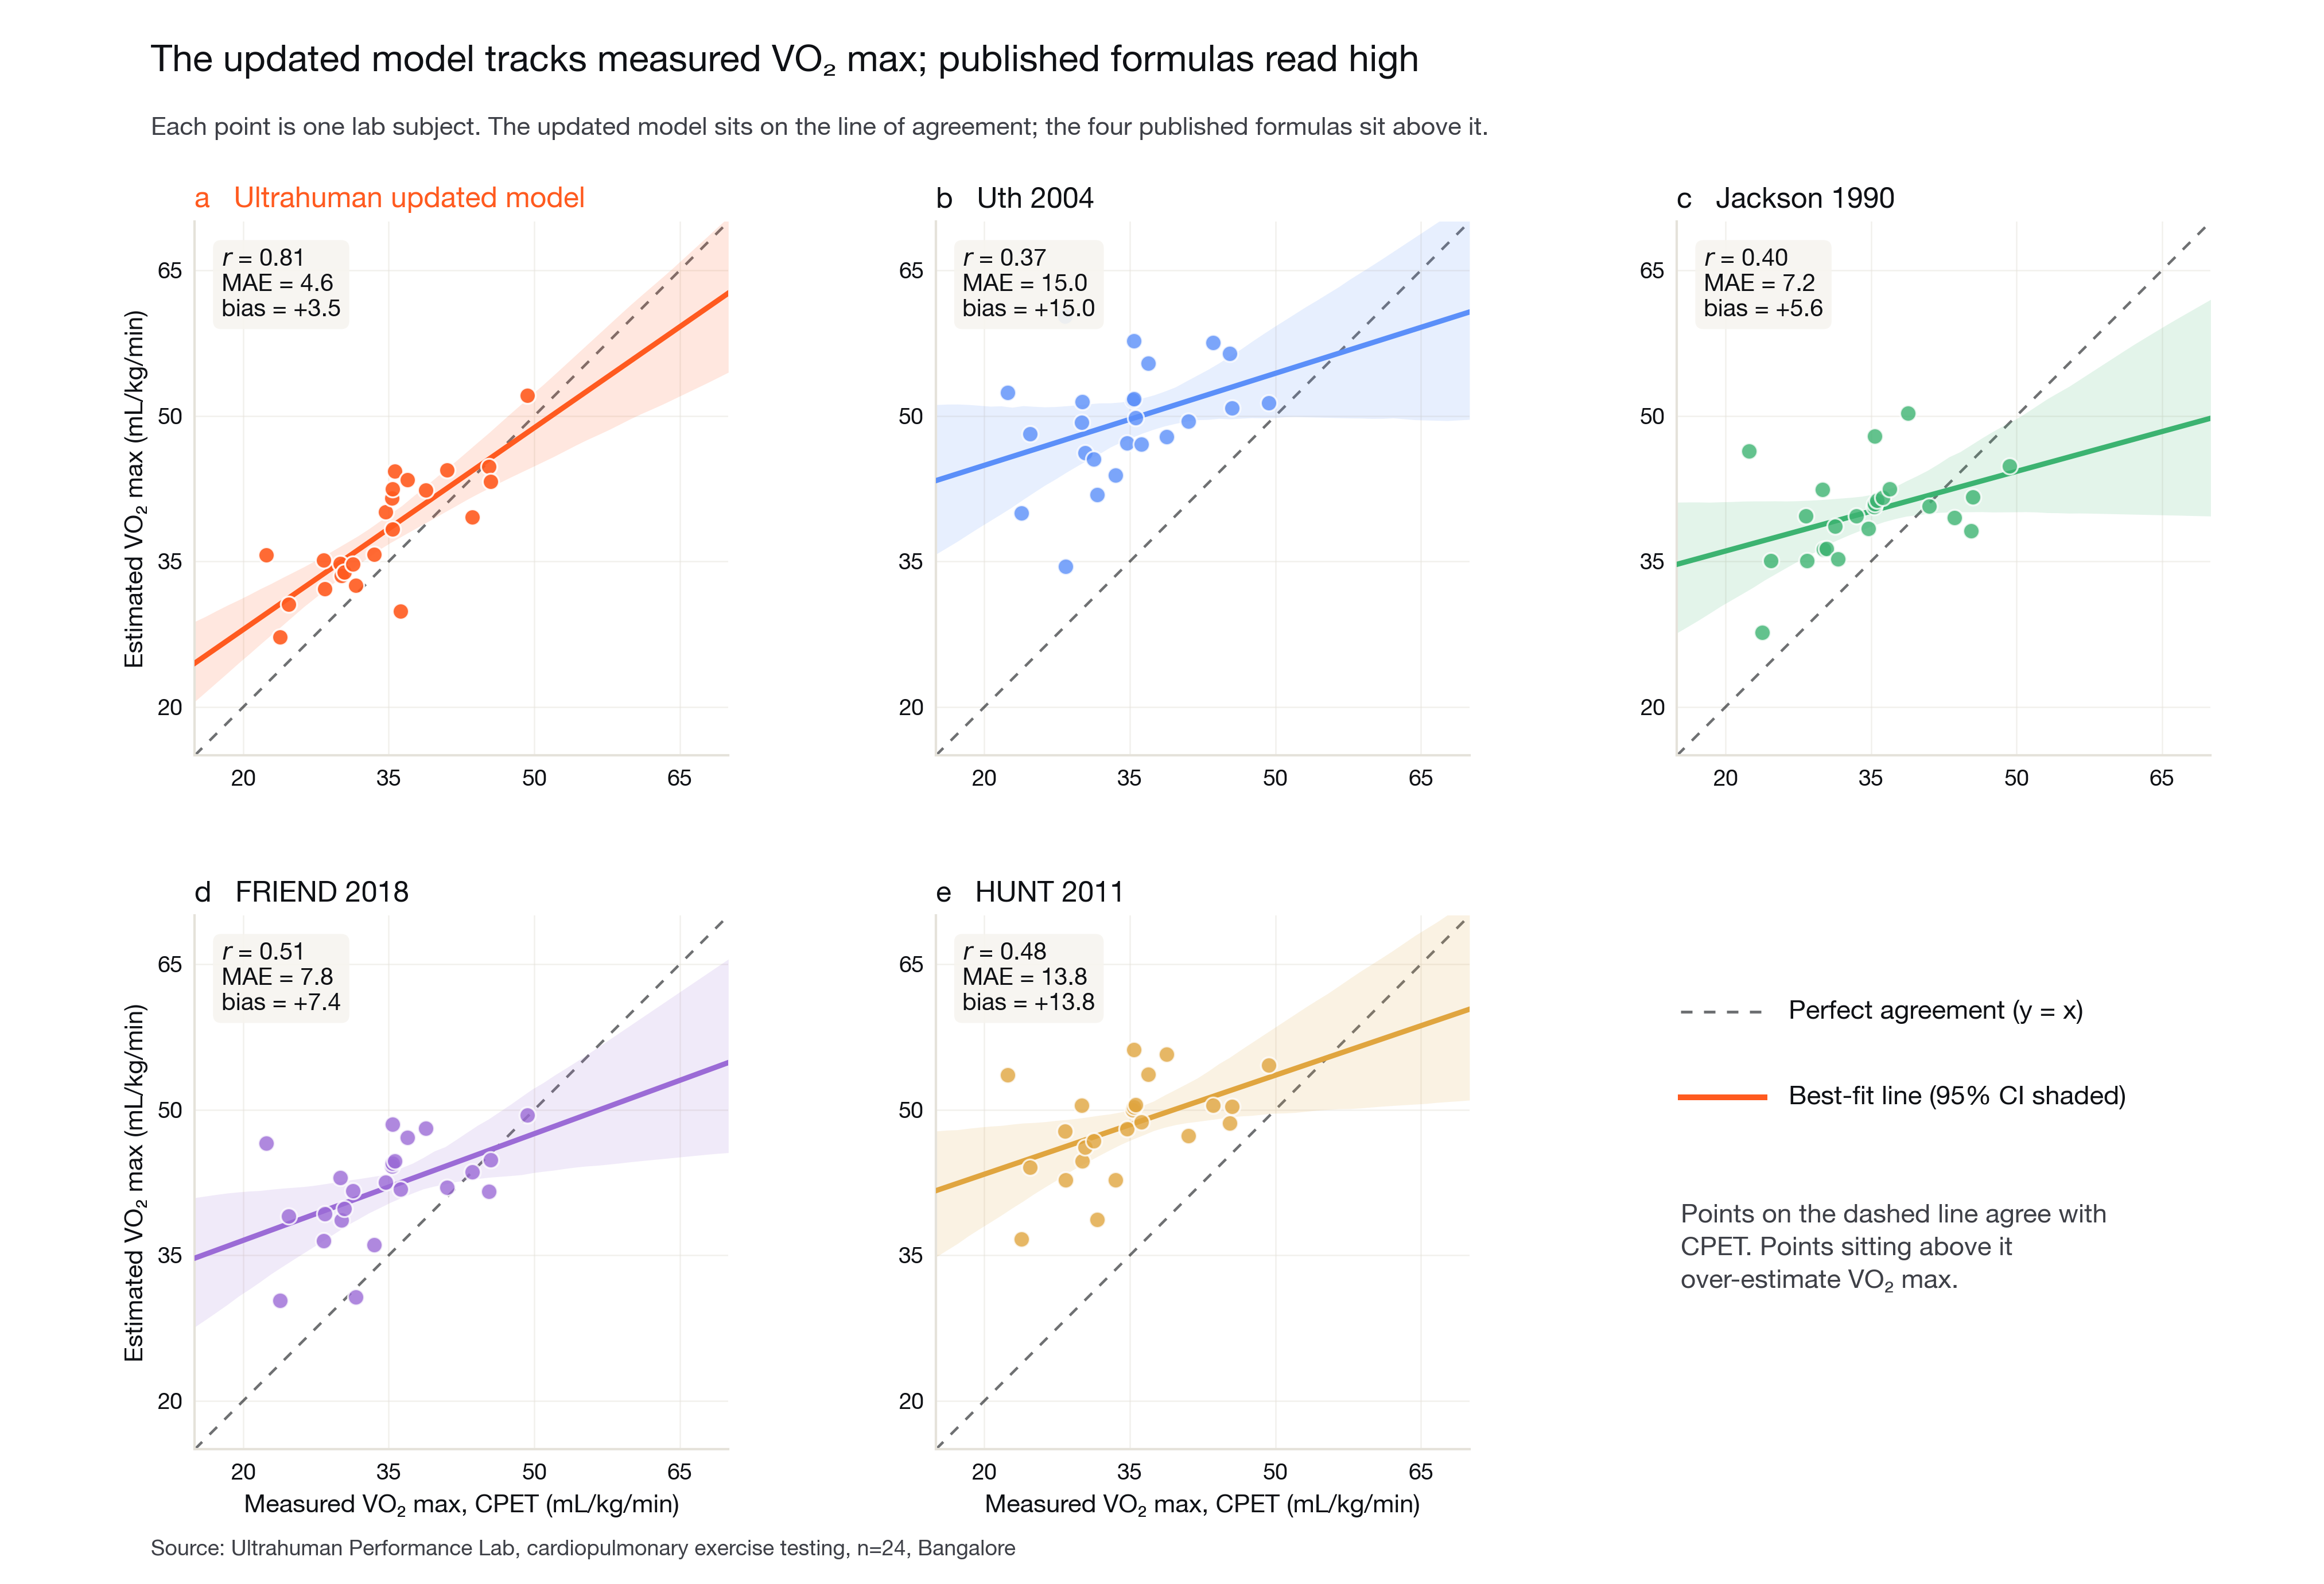
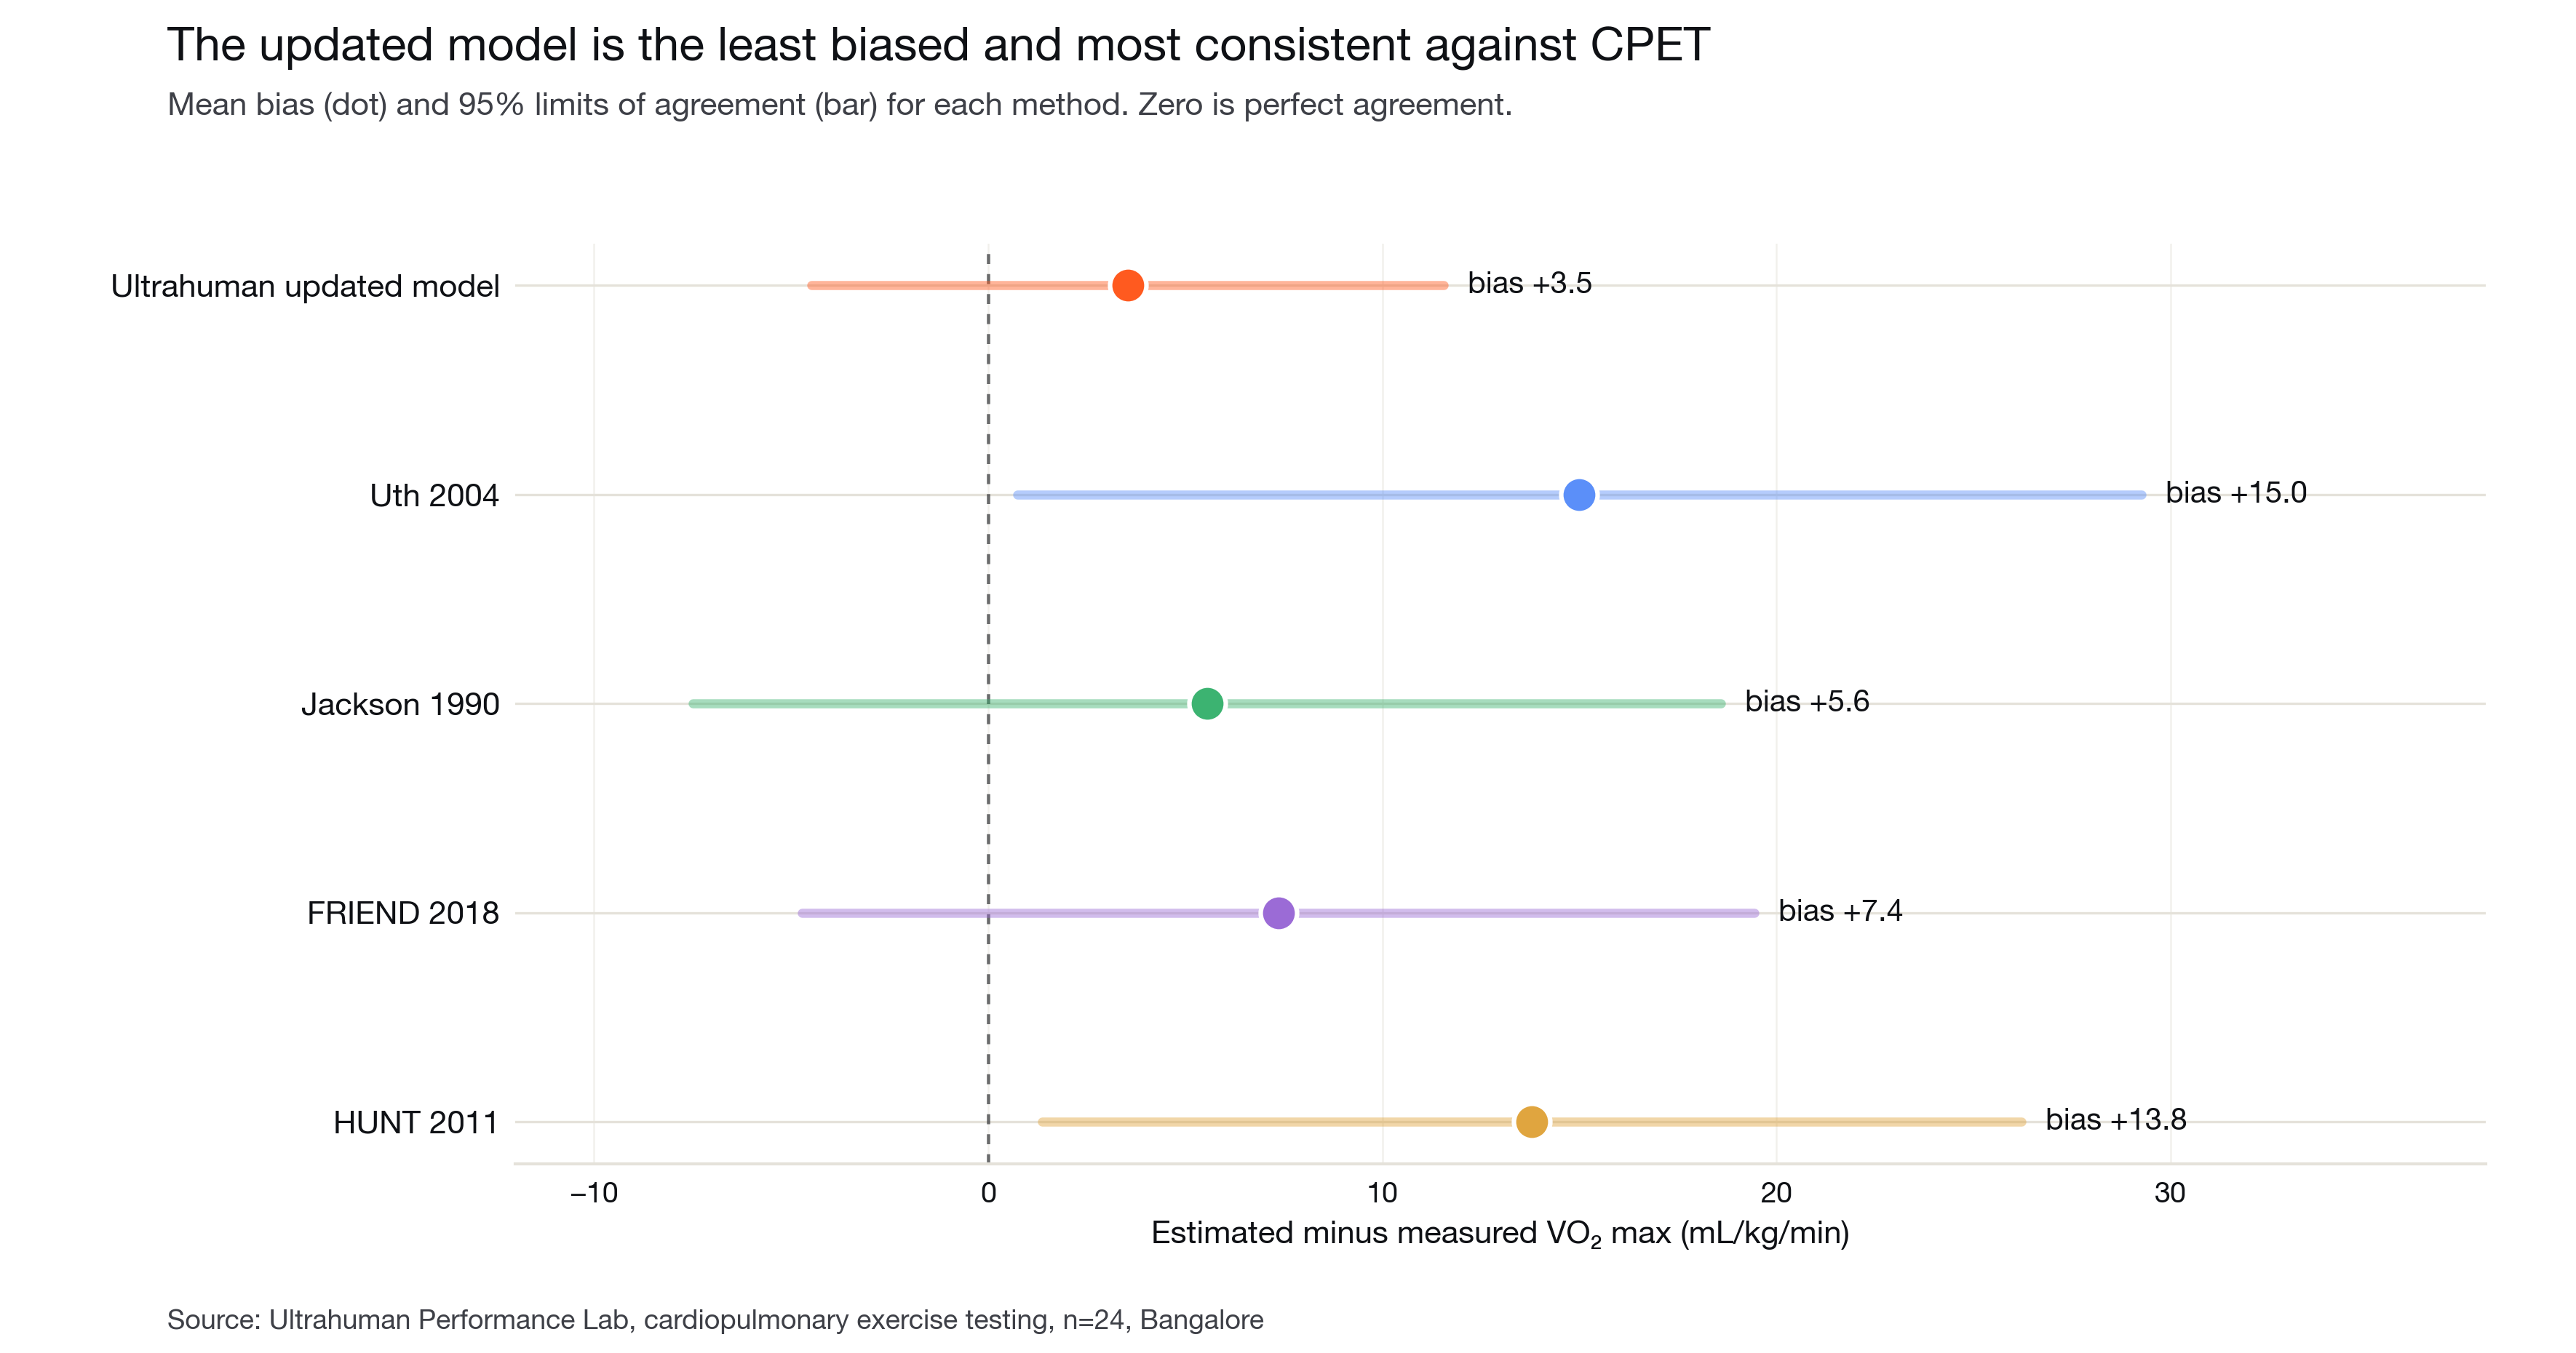
It is the least biased and most consistent method. Every method overestimated VO2 max on this cohort, but the updated model overestimated the least: a mean biasof +3.5 mL/kg/min, against +5.6 (Jackson), +7.4 (FRIEND), +13.8 (HUNT), and +15.0 (Uth). Its limits of agreement were also the tightest, so its errors are smaller and more consistent across people, and its regression slope against CPET was the steepest of any method, so it best preserves real differences between fitter and less fit members (Figure 4).
At population scale, the pattern holds. Across 2,418 members, the updated model’s median estimate was 33 mL/kg/min. Every published formula read higher: medians of 36 (Jackson), 37 (FRIEND), 44 (HUNT), and 54 (Uth). The same overestimation seen against lab ground truth reappears across the whole population, while the updated model lands in a physiologically reasonable band (Figure 5).
Estimating VO2 max well is hard precisely because the reference testis rare. Off-the-shelf formulas fill that gap, but they were developed on populations and inputs that differ from any given member, and on this cohortthey read systematically high. Tuning the estimate to ground truth measured in our own lab closes most of that gap: the updated model agrees with CPET more closely and more consistently than any of the four published methods tested. Because fitness maps onto mortality risk, the difference is not cosmetic. Onthe modelled relationship in Figure 1, the error reduction from a published formula to the updated model corresponds to a materially more accurate placement on the risk curve.
The comparison is deliberately asymmetric, and that asymmetry is the point. The published formulas were applied off the shelf, while the updated model was calibrated to ground truth measured in this lab. Closing the gap between a generic estimate and a measured one is exactly what an in-house performance lab makes possible.
Several limitations are worth stating plainly. The ground-truth cohort is single-site and modest (n = 24), drawn from one population; the model’s population-level calibration is applied for the global member base and will be refined as CPET data from more populations accrues. The HUNT baseline required inputs a ring does not capture (waist circumference and astructured activity questionnaire), which were approximated, so its numbers should be read with that caveat. These are open directions for the work, not its conclusion. Ultrahuman is expanding CPET testing across more members and geographies, which will both widen the validation set and sharpen the calibration.
The broader point is one of capability. VO2 max is among the most consequential numbers a wearable can report, and Ultrahuman measures its ground truth in-house rather than relying on a published constant. Grounding the estimate in measured physiology, and continuing to measure as the member base grows, is how the number stays honest.
The pattern in Figure 5 has a direct consequence at the level of an individual member. Every published estimator tested in this paper reads systematically above CPET, by 3 to 21mL/kg/min at the population median; the in-app estimate before this update sat in the same range. When the updated model rolls in, each member’s reading moves from that generic-estimator range to the lab-calibrated level reported throughout this paper.
The update arrives as a one-time alignment, then runs as a normal trend. Across 2,567 members evaluated in an in-house cutover simulation against their preceding three weeks of ring data, the median switchover-day change is about −11mL/kg/min. About 94% of members settle to a slightly lower estimate and about 6% settle slightly higher; roughly 8 in 10 see a change greater than 5mL/kg/min and about 6 in 10 greater than 10 (Figure 6). The size of the adjustment depends on where a member’s previous reading sat relative to the lab-calibrated value: members whose previous reading was already close to the CPET-anchored level see small adjustments, and those whose previous reading sat well above it see larger ones, mirroring the asymmetry shown for the four published formulas in Figure 5.
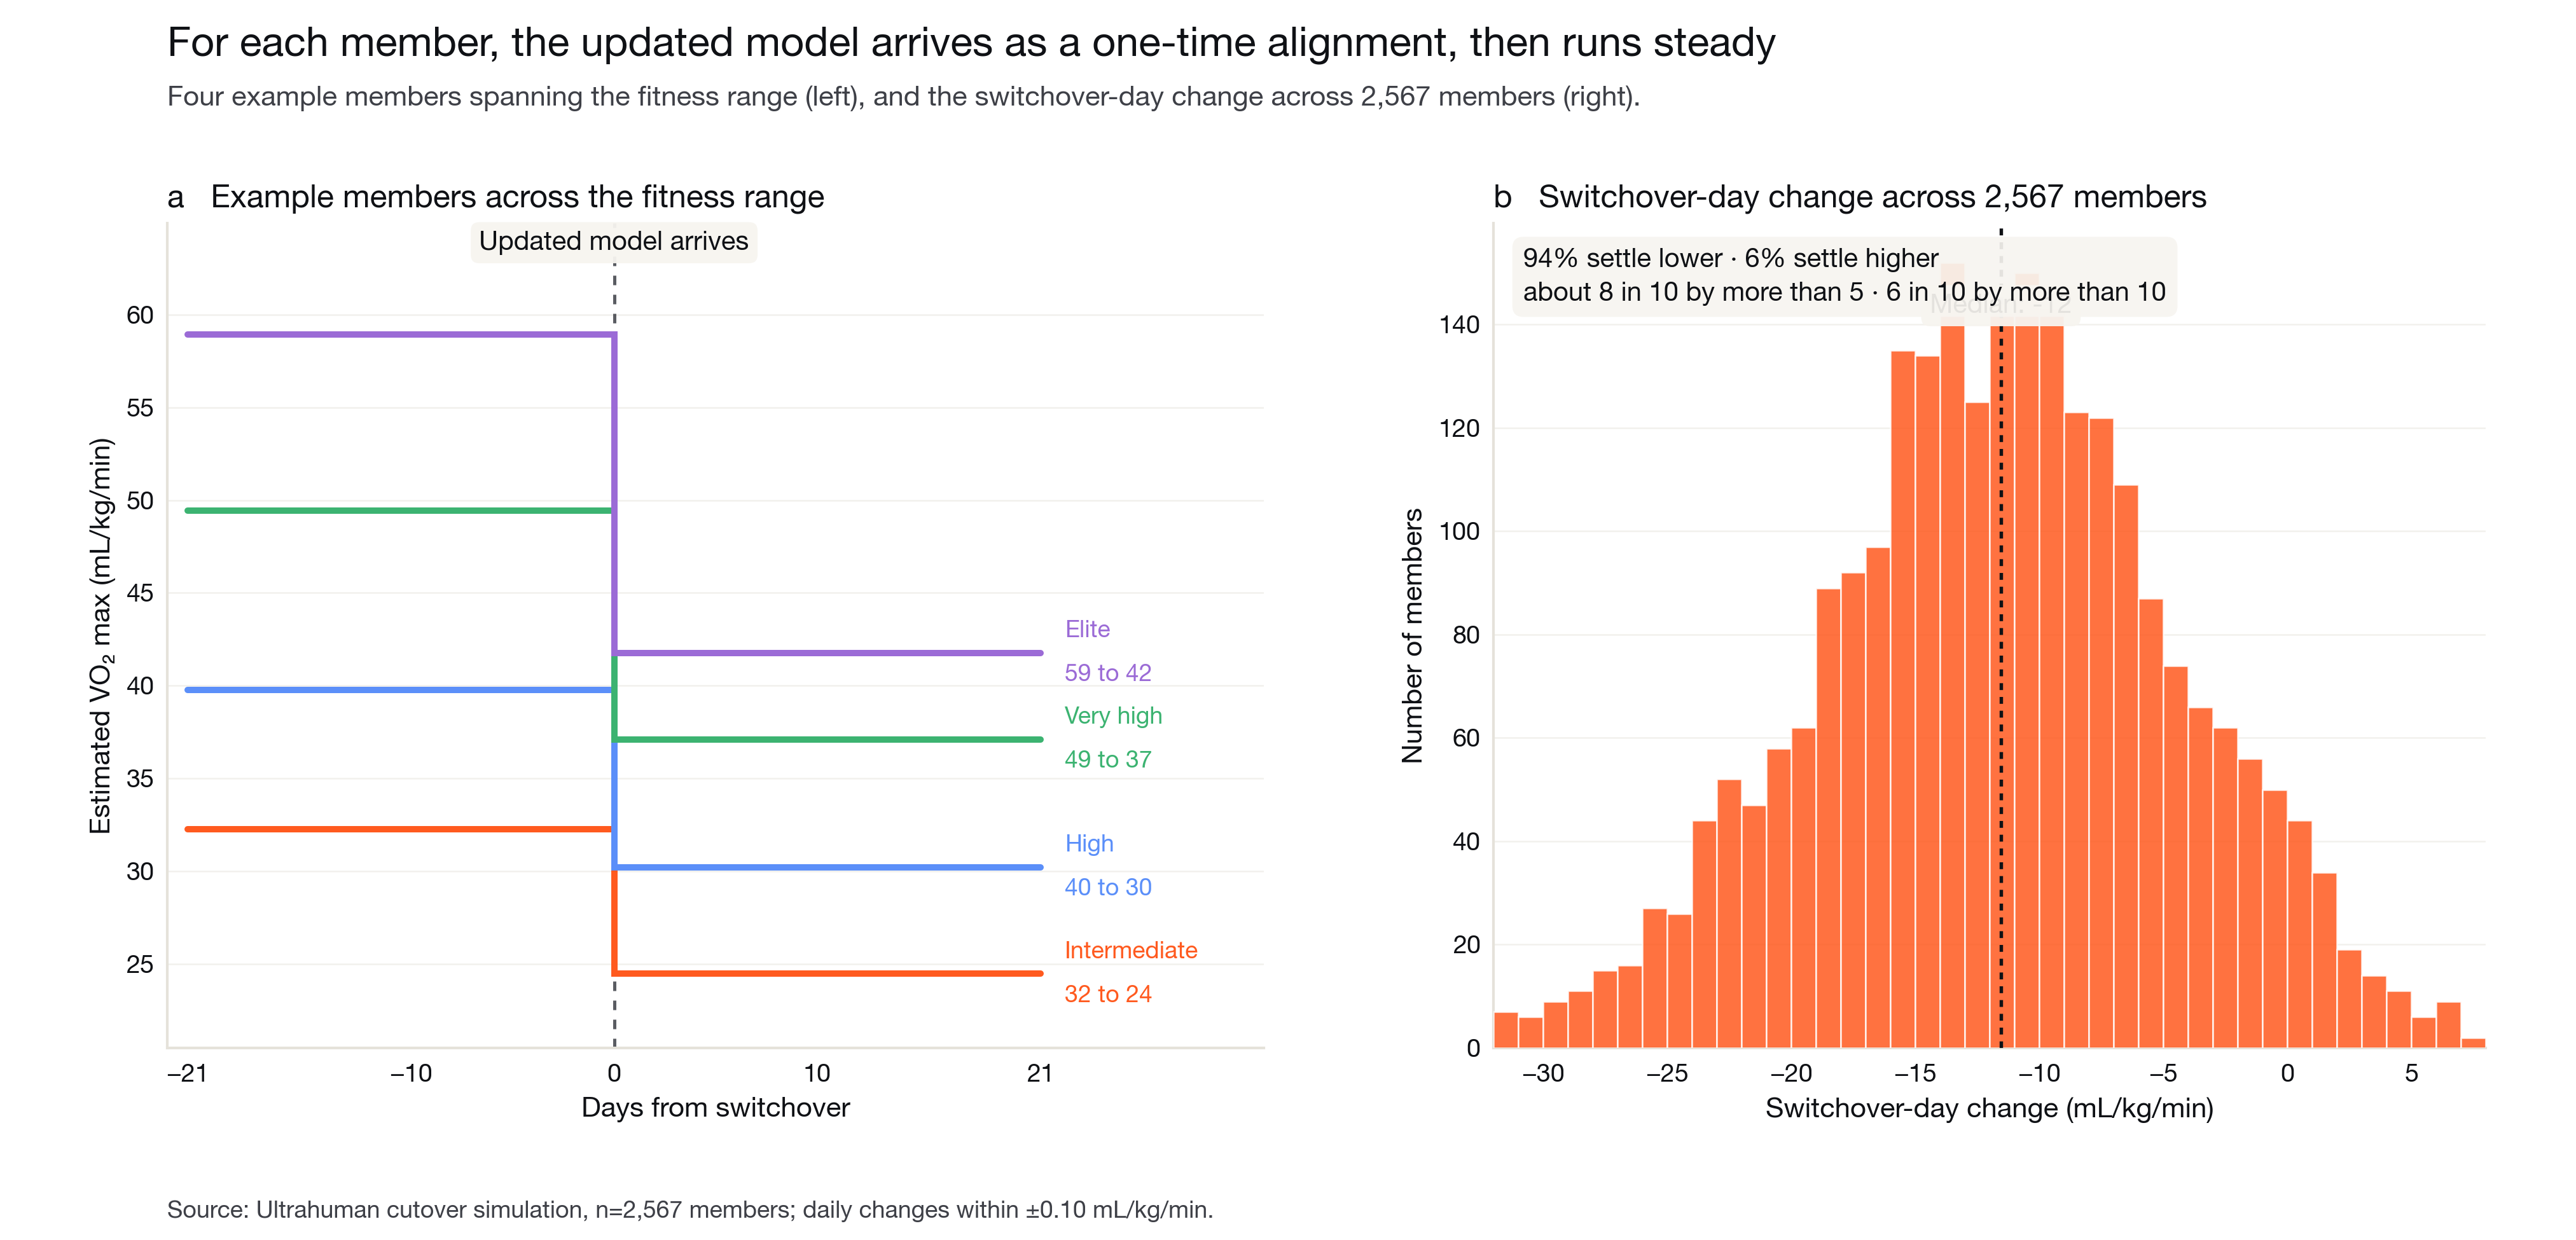
After the switchover the estimate runs as a normal trend. Day-to-day changes are within ±0.10 mL/kg/min, so once the one-time alignment has happened the reading reflects only the member’s actual changes in resting heart rate and activity, as it always has.
A member’s fitness has not changed on the day the updated model arrives. What has changed is the calibration of the estimate: it now reflects the lab ground truth this paper describes.
1. Kodama S, Saito K, Tanaka S, etal. Cardiorespiratory fitness as a quantitative predictor of all-causemortality and cardiovascular events in healthy men and women: a meta-analysis. JAMA2009;301(19):2024–2035.
2. Mandsager K, Harb S, Cremer P,Phelan D, Nissen SE, Jaber W. Association of cardiorespiratory fitness withlong-term mortality among adults undergoing exercise treadmill testing. JAMANetw Open 2018;1(6):e183605.
3. Ross R, Blair SN, Arena R, etal. Importance of assessing cardiorespiratory fitness in clinicalpractice: a case for fitness as a clinical vital sign. Circulation2016;134(24):e653–e699.
4. Balady GJ, Arena R, Sietsema K,et al. Clinician’s guide to cardiopulmonary exercise testing in adults: ascientific statement from the American Heart Association. Circulation2010;122(2):191–225.
5. Uth N, Sørensen H, Overgaard K,Pedersen PK. Estimation of VO2max from the ratio between HRmax and HRrest: theheart rate ratio method. Eur J Appl Physiol 2004;91(1):111–115.
6. Jackson AS, Blair SN, Mahar MT,Wier LT, Ross RM, Stuteville JE. Prediction of functional aerobic capacitywithout exercise testing. Med Sci Sports Exerc 1990;22(6):863–870.
7. de Souza e Silva CG, KaminskyLA, Arena R, et al. A reference equation for maximal aerobic power fortreadmill and cycle ergometer exercise testing: analysis from the FRIENDregistry. Eur J Prev Cardiol 2018;25(7):742–750.
8. Nes BM, Janszky I, Vatten LJ,Nilsen TIL, Aspenes ST, Wisløff U. Estimating VO2peak from a nonexerciseprediction model: the HUNT Study, Norway. Med Sci Sports Exerc2011;43(11):2024–2030.