Bedroom CO₂, humidity and temperature stability move ring-derived sleep architecture across 121,598 paired nights, with effects in the directions chamber RCTs predict and at smaller magnitudes
Bedroom paremeters affect deep sleep.
The chamber-RCT literature on bedroom environment and sleep is structurally clean and quantitatively narrow. The canonical CO₂ trial paired bedroom-air conditions of approximately 660 ppm against approximately 2,585 ppm in single-occupancy student dormitories across two crossover experiments, and reported significantly improved actigraphy-recorded sleep quality, perceived freshness, next-day sleepiness, ability to concentrate, and logical-thinking performance at the lower CO₂ condition with bedroom temperature held constant (Strøm-Tejsen et al., 2016). The thermal-environment narrative review pooling chamber findings reports that humid heat reduces both slow-wave and REM sleep, that even mild thermal departures load the cardiac autonomic system, and that the relevant exposure variable is departure from the individual's preferred range rather than absolute temperature (Okamoto-Mizuno and Mizuno, 2012). The WHO-commissioned environmental-noise meta-analysis pooling 74 polysomnographic studies estimated that the odds of cortically-confirmed awakening rise approximately 35 percent per 10 dBA increase in indoor sound level, with the dose-response anchored at transportation-noise levels of approximately 45 to 65 dB (Basner and McGuire, 2018).
What those studies cannot directly resolve is the field-scale signal in real bedrooms at the in-the-wild ranges most members live in. Chamber RCTs select extreme exposures by design; the empirical question is whether the chamber-derived directions reproduce when the exposure variation is the narrower distribution of actual home environments.
Across 121,598 paired Ultrahuman Home and Ring user-nights from 1,242 members between January 2024 and April 2026, three of the four ambient axes the Home device tracks moved sleep architecture in the directions the chamber literature predicts, with effect magnitudes approximately three to ten times smaller than the chamber RCT effect sizes.
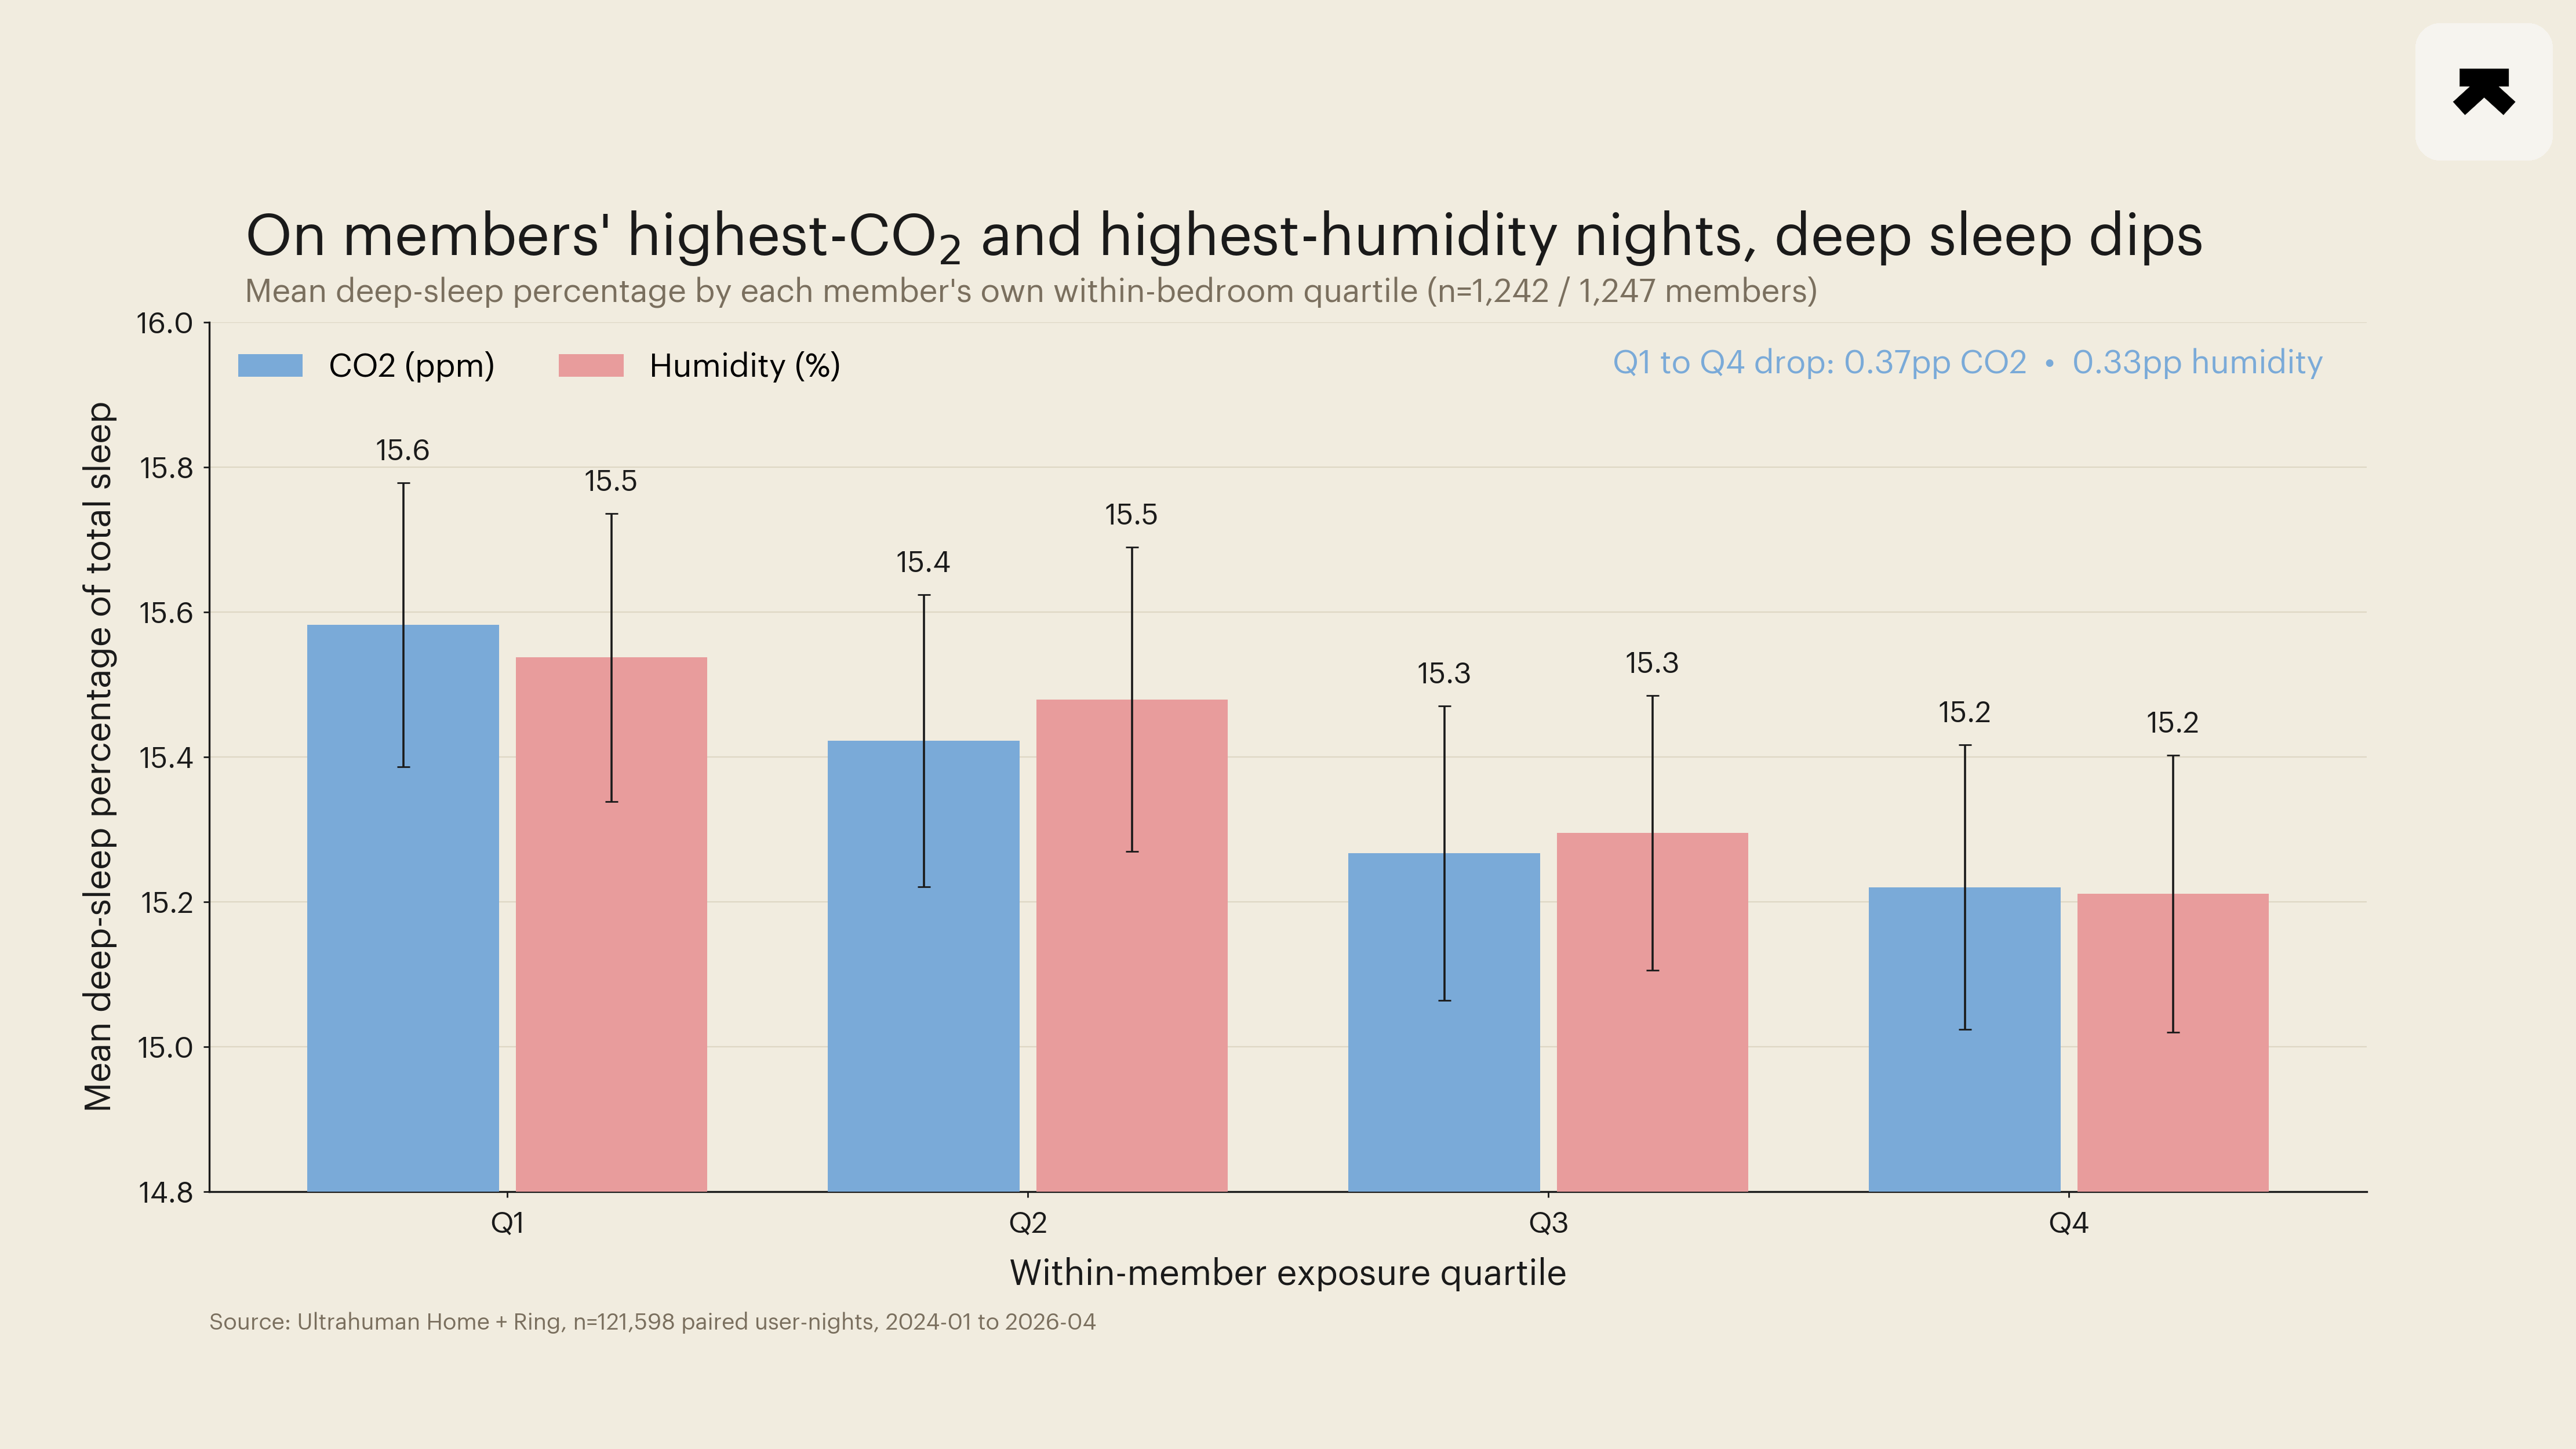
CO₂ and humidity each cost approximately 0.3 percentage points of deep-sleep proportion at the highest within-member quartile relative to the lowest; bedroom-temperature drift cost approximately 0.36 sleep-score points at the highest within-member deviation quartile; ambient noise produced no architectural effect at the 35-to-41 dB range carried by the cohort.
The achieved tier is B: confidence intervals on three of four headline contrasts cleanly excluded zero, but the absolute effect magnitudes sat below the 1.5-point sleep-score threshold pre-specified in the analysis plan, so the post-language ceiling is descriptive rather than confirmatory.
Cohort definition. Eligible nights had a row in uh_home_daily_summaries for a member with an active link in uh_home_user_uh_homes, a corresponding row in sleep_indices for the same user_id and day with index_valid = TRUE, and a parsed exposure value (CO₂ ppm, noise dB, bedroom temperature in degrees Fahrenheit, humidity percent) for the axis under analysis. Ultrahuman staff (internal_user = TRUE) were excluded at the SQL level. After per-user quartiling, members with fewer than 14 paired user-nights were dropped (the threshold below which within-user quartile boundaries become unstable). Per-axis cohort sizes ranged from 1,244 to 1,249 members; the gross paired-night count was 121,598. The pre-registered anonymity floor of at least 100 user-nights and at least 30 distinct members per published cell was respected with significant margin.
The within-member design is worth naming. For each member and each axis (CO₂, noise, humidity, and absolute deviation of bedroom temperature from the member's own median), the member's nights were quartiled by their own exposure values; the contrast was the across-member pooled mean of (Q4-mean − Q1-mean) on the outcome of interest. This design strips out trait-level confounders (age, fitness, ring-fit quality, baseline HRV, sleep schedule, partner presence) by construction; what remains is the within-member coupling between the bedroom variable and the same night's sleep. The trade-off is that the design cannot detect across-member differences in environmental sensitivity, only within-member dose-response.
The CO₂ result and its duration confound. Q1 nights averaged 509 ppm bedroom CO₂; Q4 nights averaged 896 ppm; the within-member contrast on deep-sleep percentage was −0.37 percentage points (95 percent CI -0.55 to -0.20). The contrast on overall sleep score was +1.17 points in the same direction (95 percent CI +0.87 to +1.46), but Q4 nights also carried 13.9 minutes more total sleep on average. The sleep-score formula gives partial credit for total sleep duration, so a longer-time-in-bedroom night both accumulates more CO₂ in a closed room and earns a higher sleep score for reasons unrelated to bedroom air. The headline for this axis is therefore the duration-immune deep-sleep-percentage contrast (-0.37 pp), not the duration-confounded score contrast. The post explicitly flags the confound rather than reporting the headline number alone.
The humidity and temperature-deviation results. Q1 humidity averaged 40 percent, Q4 averaged 54 percent; the within-member contrast on deep-sleep percentage was -0.32 percentage points (95 percent CI -0.48 to -0.15), in the direction the Okamoto-Mizuno review predicts on the basis that humid air slows evaporative cooling during the slow-wave thermoregulation dive. Bedroom temperature was operationalised as the absolute deviation of nightly average from each member's own median; Q1 averaged 0.4 degrees Fahrenheit off median, Q4 averaged 4.5 degrees off; the within-member contrast on overall sleep score was -0.36 points (95 percent CI -0.66 to -0.07). The choice of absolute deviation rather than absolute temperature is principled on the chamber literature's finding that thermal departures in either direction (warmer or cooler than the body's preferred range) cost sleep; using member-specific median as the reference adjusts for individual differences in preferred sleeping temperature.
The noise null. Q1 nights averaged 35 dB ambient sound; Q4 averaged 41 dB. Within-member contrasts on sleep score, deep-sleep percentage, and awake-time-in-minutes were all small with confidence intervals brushing zero. Smaller movements appeared on overnight HRV (+0.41 ms with CI excluding zero) and lowest heart rate (-0.20 bpm with CI excluding zero) but not on architectural outcomes. The narrow within-cohort dB range is the most parsimonious explanation: the WHO-commissioned dose-response is anchored at 10 dBA steps over a transportation-noise range of approximately 45 to 65 dB, which is louder than the typical Ultrahuman bedroom in the cohort. The null reported here describes the in-the-wild dB range, not the dose-response curve at louder exposures.
Fleet-level distribution context. Across the 121,598 paired nights, 10.5 percent crossed the ASHRAE bedroom action threshold of 1,000 ppm CO₂ on the daily average; 15.0 percent crossed 1,500 ppm on peak. 31.7 percent of nights ran at or above the WHO recommended 40 dB Lₙᵢgₕₜ ceiling, and 13.0 percent ran at or above 45 dB. 33.7 percent of nights had bedroom temperatures outside the ASHRAE comfort band of 60 to 75 degrees Fahrenheit; 17.6 percent had humidity outside 30 to 60 percent. Roughly one in three paired nights carried at least one ambient axis outside the relevant guideline boundary; roughly one in ten crossed the more conservative ASHRAE CO₂ ceiling on a daily-average basis.
Caveats are several and worth naming directly. The Home daily summary covers a 24-hour window, not the sleep window specifically; CO₂ and humidity vary slowly and likely track sleep-window exposure reasonably closely, but noise and temperature can be daytime-dominated, and effect attenuation from the temporal mismatch is expected. The within-member design cannot test causation; bedroom environment may be correlated with sleep-altering behaviours (late dinners, alcohol, TV use, partner presence) that are the proximate drivers. The achieved tier is B: confidence intervals exclude zero on three of four axes, but the absolute effect magnitudes are smaller than the pre-registered 1.5-sleep-score-point threshold, and the post-language is associational throughout. Stratifications by age band, sex and country were declared exploratory in the analysis plan and are deferred to follow-up runs. The ambient-axis quartiles describe within-member exposure variation; cross-member effect heterogeneity (some members' sleep is more environmentally sensitive than others') is not resolved here.
What the analysis adds is a field-scale partial replication of three chamber-RCT directions at the resolution of consumer-wearable telemetry, in a cohort an order of magnitude larger than the largest individual chamber study. The directions match. The magnitudes are smaller, in proportion to the narrower exposure range that real bedrooms occupy. The most informative single number in the analysis is probably the noise null at 35-to-41 dB: the chamber-derived dose-response remains correct, but the typical Ultrahuman bedroom does not sit on the part of the dose-response curve where it operates. The CO₂ and humidity results sit on the part of their respective dose-response curves where the chamber literature predicts a small but real effect; the field signal here is consistent with that prediction.
- Strøm-Tejsen P, Zukowska D, Wargocki P, Wyon DP. The effects of bedroom air quality on sleep and next-day performance. Indoor Air, 2016. PMID: 26452168.
- Okamoto-Mizuno K, Mizuno K. Effects of thermal environment on sleep and circadian rhythm. Journal of Physiological Anthropology, 2012. PMID: 22738673.
- Basner M, McGuire S. WHO Environmental Noise Guidelines for the European Region: A Systematic Review on Environmental Noise and Effects on Sleep. International Journal of Environmental Research and Public Health, 2018. PMID: 29538344.