Normal LDL-C, elevated ApoB: how often Ultrahuman's cohort carries the discordance the new guidelines target
Ultrahuman looked at data from more than 3,000 users and found that some people with normal LDL still had elevated ApoB levels.
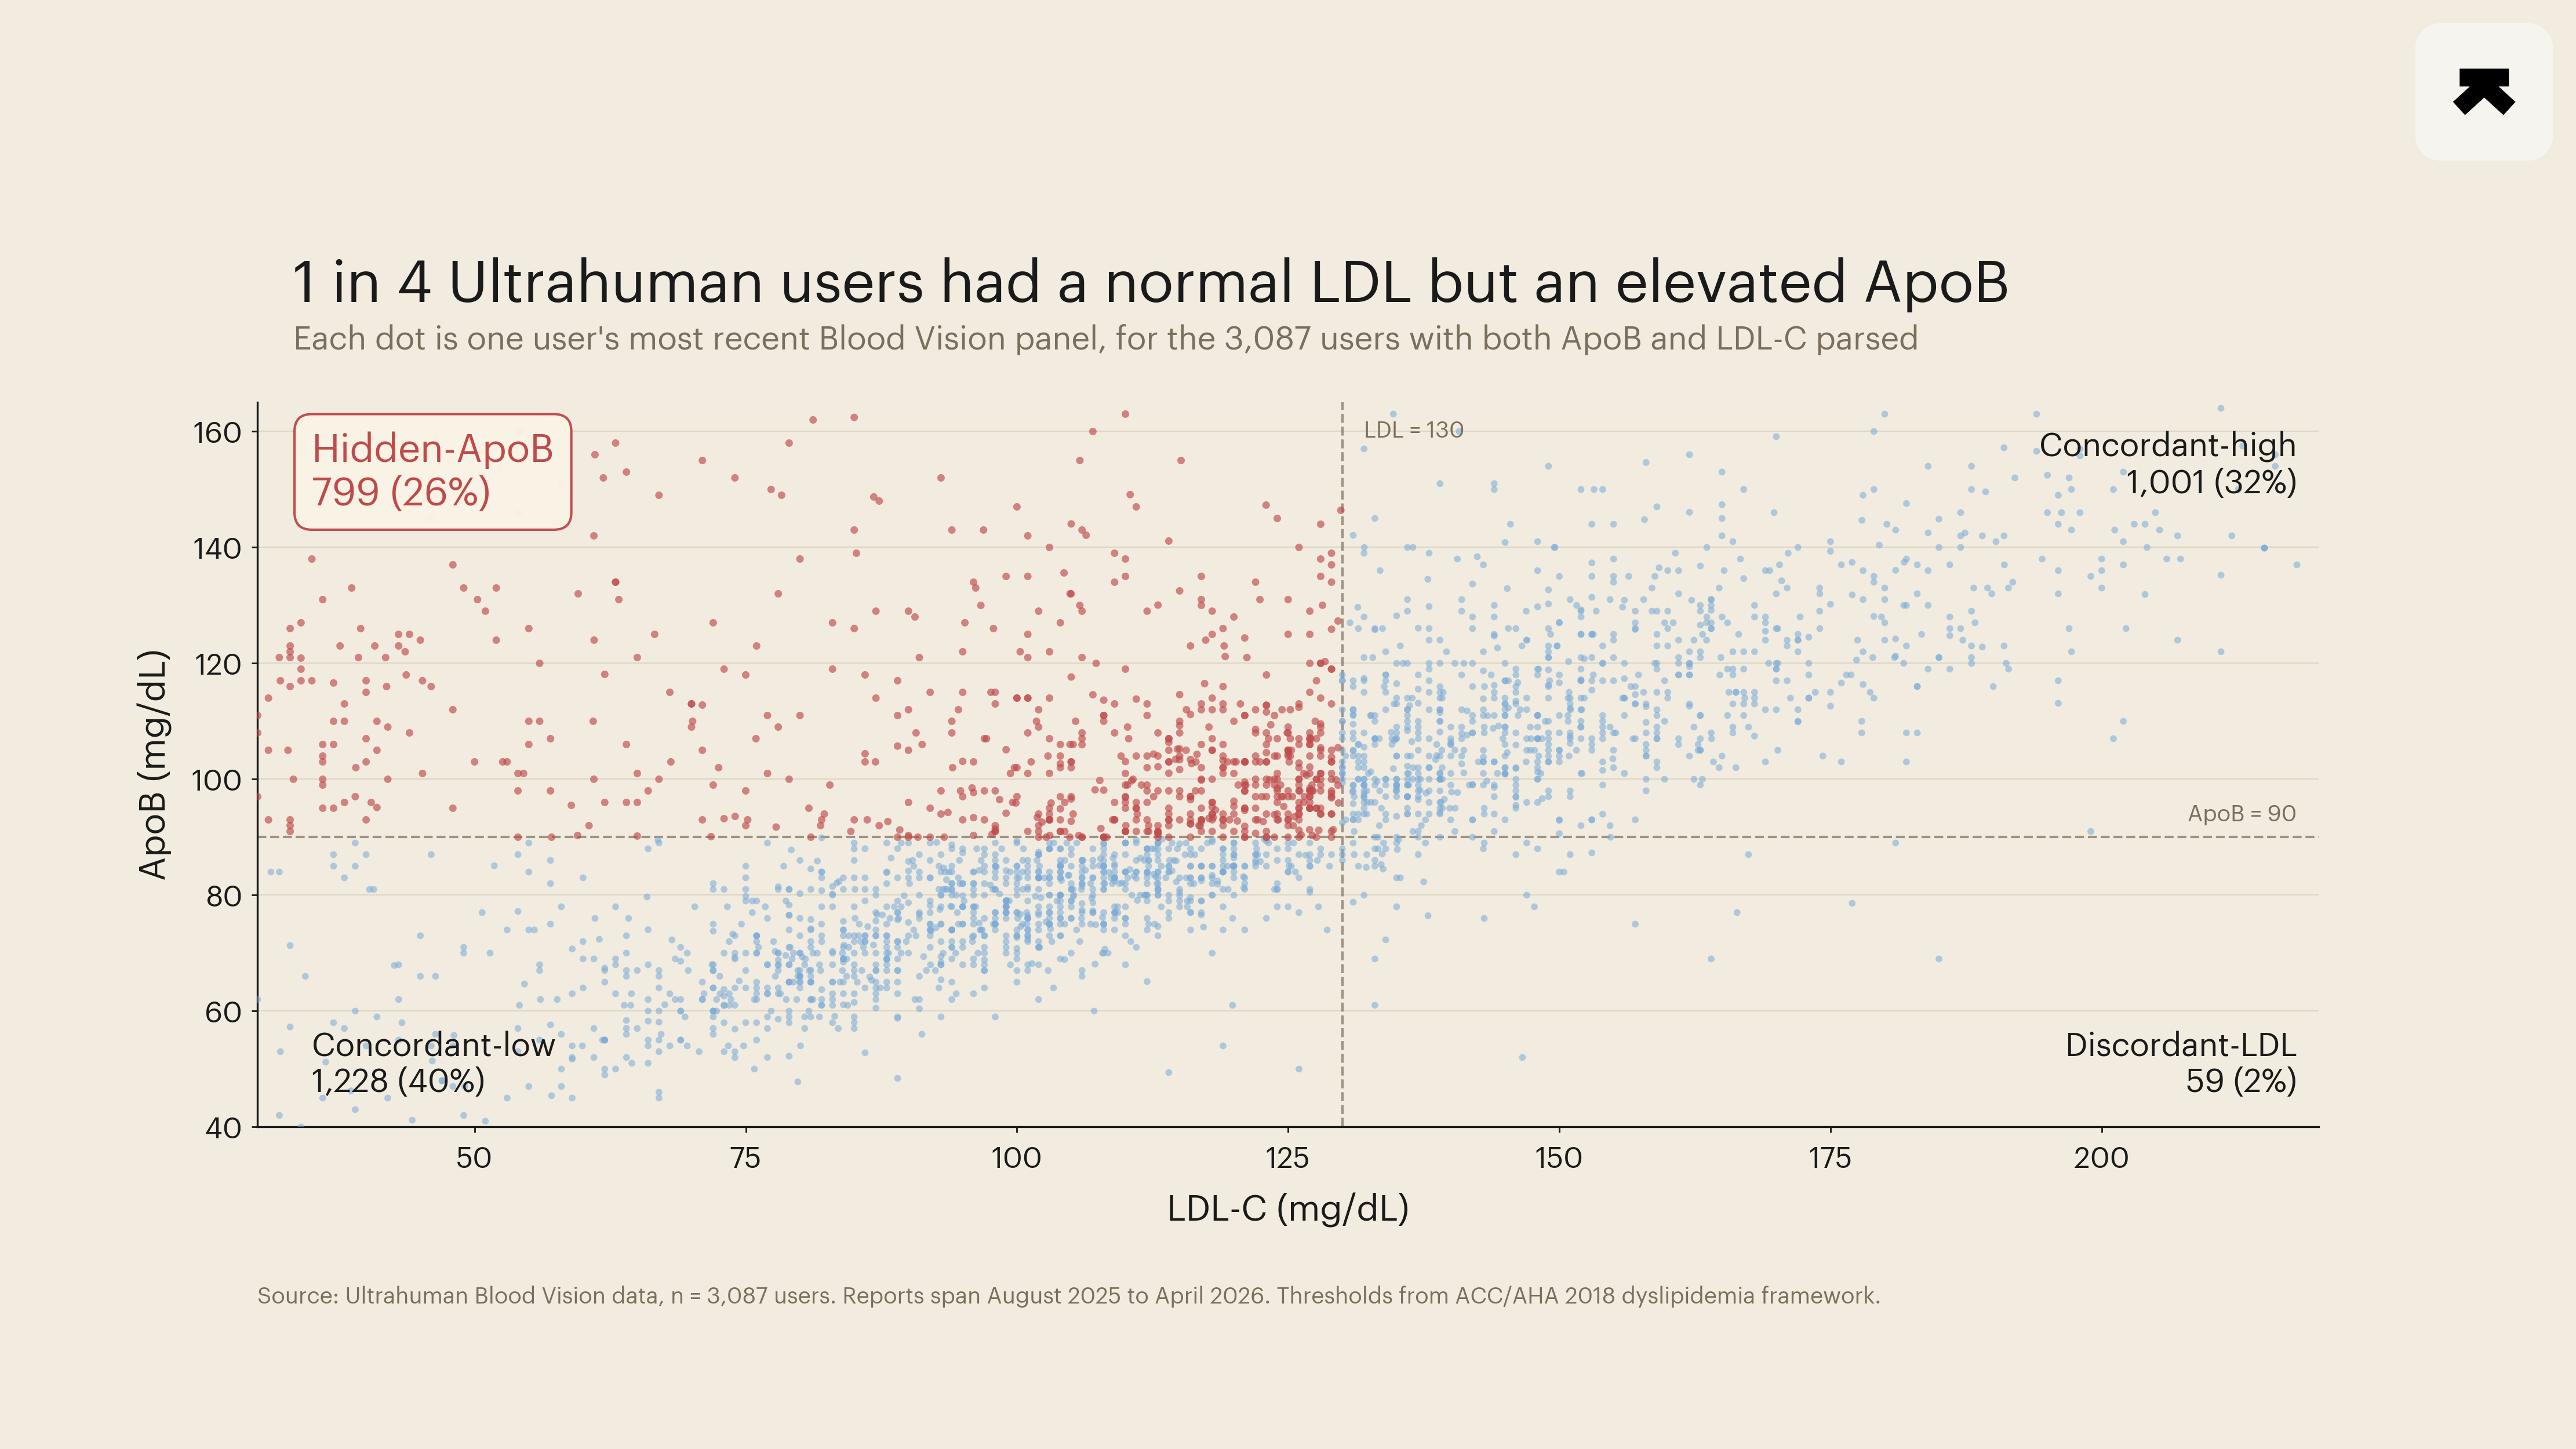
A JAMA cost-effectiveness simulation in March 2026 argued that an apolipoprotein B (ApoB) goal beats both LDL-C and non-HDL-C targets in 65 percent of probabilistic scenarios for primary prevention (Luebbe et al., 2026). That paper sharpened a question the lipid field has been edging toward for a decade. How often does the discordant pattern, a normal-looking LDL-C alongside an elevated ApoB, appear in real cohorts where a particle-count target would catch what a cholesterol target would miss? Ultrahuman's Blood Vision panels offer one descriptive read. Across 3,087 members with both markers parsed from the same draw between August 2025 and April 2026, 26 percent had LDL-C below 130 mg/dL while their ApoB sat at or above 90 mg/dL. The reverse pattern, elevated LDL-C with normal ApoB, appeared in 2 percent. When the two numbers disagree in this cohort, ApoB is almost always the marker carrying the harder news.
ApoB indexes risk differently from LDL-C. Each atherogenic particle (LDL, IDL, VLDL, Lp(a)) carries exactly one ApoB on its surface, so the assay counts particles directly rather than weighing the cholesterol cargo inside them. Two people with identical LDL-C can host very different particle counts, and the higher-count individual sits at materially higher cardiovascular risk.
The mechanistic case has been accumulating epidemiological support. A UK Biobank analysis of 432,092 participants followed for a median 13.3 years found ApoB to be a stronger predictor of cardiovascular disease than LDL-C in men, with triglycerides taking the dominant role in women (Kelly et al., 2026). In a separate analysis of UK Biobank participants with type 2 diabetes, an "excess ApoB" measure delivered a continuous net reclassification index of 0.270 over standard lipid panels, with the largest reclassification gain concentrated in statin users whose LDL-C had already fallen to or below 100 mg/dL (Lyu et al., 2026). The cohort with the most to gain from ApoB testing, in other words, is precisely the cohort whose LDL-C looks reassuring on a standard panel.
The data here are cross-sectional and self-selected. Members who upload a Blood Vision panel skew toward an already engaged tracking population. In this cohort, median age was 37 (IQR 31 to 44), with 1,993 men, 1,038 women, and 56 of unrecorded sex. For each member we took the most recent ready report carrying both LDL-C and ApoB values parseable from the lab YAML. Values reported in mmol/L for LDL-C were converted to mg/dL (×38.67); ApoB values reported in g/L (about 11 percent of the raw corpus) were converted to mg/dL (×100). Friedewald-calculated LDL-C entries were retained, since they are standard outputs. Cut-points followed the ACC/AHA 2018 dyslipidemia framework and the JAMA 2026 simulation: LDL-C < 130 mg/dL, ApoB < 90 mg/dL. Plausibility filters dropped obvious parsing errors (ApoB outside 15 to 400 mg/dL, LDL-C outside 15 to 500 mg/dL). All counts in stratified cells respect a pre-registered anonymity floor of 100; the one cell that fell below it (discordant-LDL, n = 59) is reported as a count and share but is not used in any sub-analysis.
Quadrant prevalence broke as follows. Concordant-low (LDL-C < 130, ApoB < 90): 1,228 members, 40 percent of the cohort. Concordant-high (both elevated): 1,001 members, 32 percent. Hidden-ApoB (LDL-C < 130, ApoB ≥ 90): 799 members, 26 percent. Discordant-LDL (LDL-C ≥ 130, ApoB < 90): 59 members, 2 percent.
A hidden-ApoB share near a quarter of an engaged-tracker cohort is consistent with the reasoning behind the recent guideline shift. The discordance is common enough that an LDL-C-only screen misses a non-trivial fraction of the people the new framing is built to flag.
The fitness overlay is more equivocal. Among the 1,817 members with at least 10 nights of ring-recorded resting heart rate in the 30 days before their draw, the hidden-ApoB group ran a median nocturnal RHR of 57.0 bpm (95 percent bootstrap CI [56.5, 58.0], 2,000 iterations) against 56.5 bpm [56.0, 57.0] in the concordant-low group. That is a 0.5 bpm gap whose CI [-0.25, +2.0] brushes zero. The direction is the one prior literature would predict, with elevated ApoB tracking with marginally higher resting heart rate as a fitness proxy, but the effect at this cohort size sits below the 2 bpm threshold pre-specified in the analysis plan and the CI does not exclude the null. A pre-specified sensitivity analysis at tighter cut-points (LDL-C < 100 mg/dL, ApoB ≥ 100 mg/dL) widened the point estimate to 1.0 bpm but with a still-wider CI of [-1.0, +3.0]. Restricting to the 30 to 49 age band did not tighten the estimate. The gap is not an age artefact, but it does not survive into significance either. Median active days per 30 (proxy: days with ≥ 4 active hours, since the warehouse workout_done flag is unreliable) showed no detectable gap. We report the RHR overlay as directional, not established.
The contribution is narrow and worth naming as such. This is a snapshot prevalence finding anchored on the same threshold framework the JAMA simulation operationalised, in a cohort large enough to clear the Tier-B floor for the prevalence claim. It does not establish a fitness-by-discordance link. The bootstrap CI on the RHR difference would need a meaningfully larger ring-overlay sub-cohort, or a longitudinal design that catches change within members rather than between them, to either firm or rule out the marginal signal seen here. Selection effects pull in both directions. The cohort is unusually engaged with their own metrics, and the 11 percent of the raw lab corpus arriving in g/L ApoB units may sample a different reporting-population distribution than the mg/dL majority. The analysis is associational. Lowering ApoB through any specific intervention is not what these data describe, and the post does not claim it.
For one shorthand: out of every four Ultrahuman members who had both numbers measured, one carried the pattern the field has spent the last eighteen months arguing should change how primary-prevention lipid panels are read.
- Luebbe S, et al. Cost-Effectiveness of ApoB, Non-HDL-C, and LDL-C Goals for Primary Prevention Lipid-Lowering Therapy. JAMA, 2026. PMID: 41949879.
- Kelly RK, et al. Sex Differences in Lipids and Lipoproteins and Their Relationship With Cardiovascular Disease: A Prospective Study of UK Biobank Participants. Journal of the American Heart Association, 2026. PMID: 41954057.
- Lyu L, et al. Association of apolipoprotein B and excess apolipoprotein B with cardiovascular risk in type 2 diabetes: UK Biobank cohort. Lipids in Health and Disease, 2026. PMID: 41535885.